
JavaScript Grids
StockSharp JS Grids is a set of browser components for displaying tabular data. The package is published on npm as @stocksharp/grids, has no third-party runtime dependencies, and can be used both with TypeScript and directly in the browser.
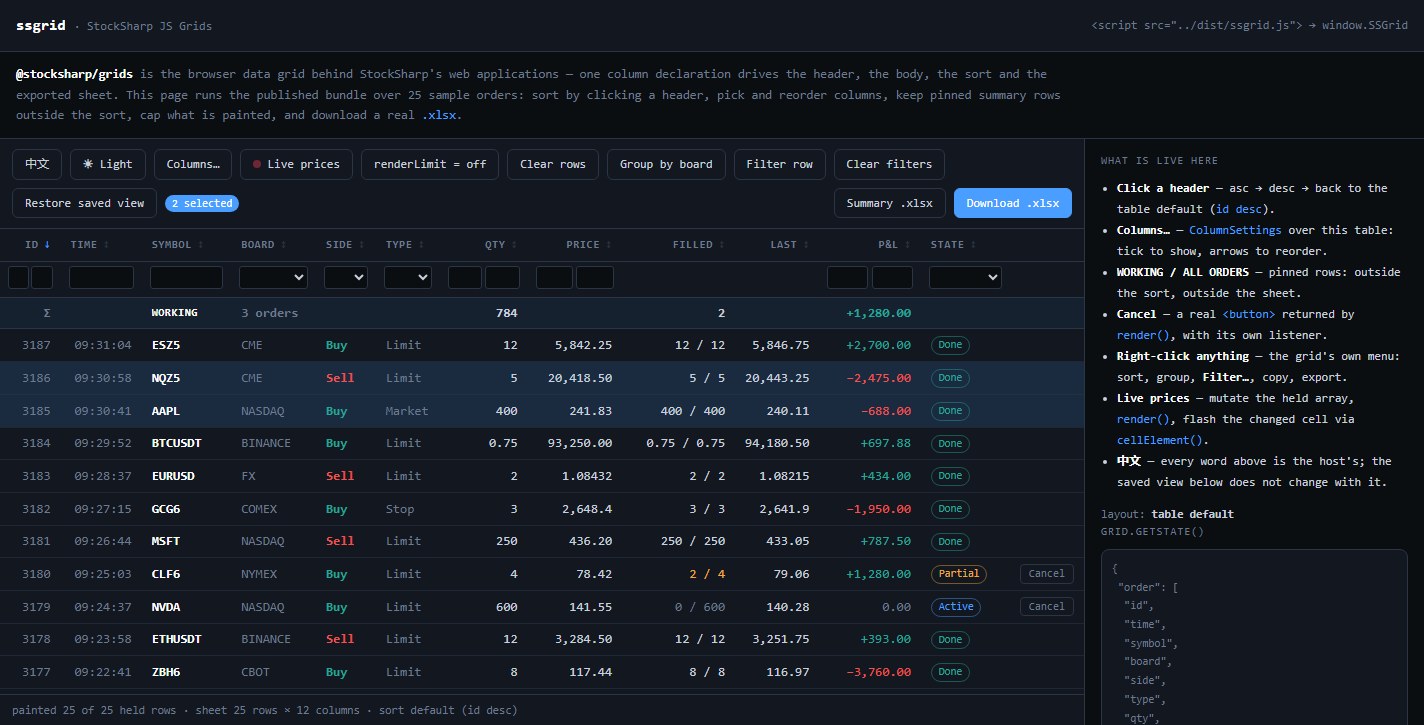
You can try the ready-made version in the online demo: headers sort rows, columns can be dragged and hidden, filters and grouping change the view, and export creates a real .xlsx file.
Package contents
- DataGrid builds the header and rows from a single column definition. It handles sorting, filters, grouping, row selection, pinned totals, the context menu, state persistence, and export.
- ColumnSettings attaches to an HTML table already rendered by the server and lets the user change the order and visibility of its columns.
- TableSort provides a standalone sorting controller for a table managed by the application.
- TableExport creates an OOXML
.xlsxworkbook without a third-party library.
DataGrid and ColumnSettings solve different tasks. The former creates the contents of <thead> and <tbody> itself from the column declarations. The latter does not create a table and is intended only for existing server-side markup with data-col attributes.
Installation
Install the package from npm:
npm install @stocksharp/grids
All main components are available from the common entry point:
import {
  DataGrid,
  ColumnSettings,
  TableSort,
  TableExport,
} from '@stocksharp/grids';
Separate entry points are provided to reduce the amount of imported code:
import { DataGrid } from '@stocksharp/grids/data-grid';
import { ColumnSettings } from '@stocksharp/grids/column-settings';
import { TableSort } from '@stocksharp/grids/table-sort';
import { TableExport } from '@stocksharp/grids/table-export';
Without a bundler, include the ready-made browser package. Its public objects are available through window.SSGrid:
<script src="https://cdn.jsdelivr.net/npm/@stocksharp/grids@1.1.0/dist/ssgrid.js"></script>
<script>
  const { DataGrid, TableExport } = window.SSGrid;
</script>
Quick example
Prepare a regular table with header and data sections:
<table id="orders">
  <thead></thead>
  <tbody></tbody>
</table>
Describe the columns once and pass the rows to the grid:
import { DataGrid, SortDirections } from '@stocksharp/grids';

interface Order {
  id: number;
  symbol: string;
  price: number;
}

const table = document.querySelector<HTMLTableElement>('#orders')!;
const grid = new DataGrid<Order>({
  head: table.tHead!,
  body: table.tBodies[0],
  columns: [
    { key: 'id', header: 'No.', value: order => order.id, filter: 'number', exportable: true },
    { key: 'symbol', header: 'Instrument', value: order => order.symbol, filter: 'text', exportable: true },
    { key: 'price', header: 'Price', value: order => order.price, filter: 'number', exportable: true },
  ],
  defaultSort: { col: 'id', dir: SortDirections.Desc },
  rowKey: order => String(order.id),
  emptyText: 'No orders',
  locale: 'en-US',
});

grid.setRows([
  { id: 101, symbol: 'SBER', price: 312.45 },
  { id: 102, symbol: 'GAZP', price: 164.18 },
]);
The library creates DOM elements but does not impose a visual design. The application stylesheet defines colors, dimensions, row highlighting, menus, the filter dialog, and utility classes.
Building from source
The repository and local demo use standard npm commands:
git clone https://github.com/StockSharp/JS-Grids.git
cd JS-Grids
npm ci
npm test
npm run build
npm run serve
Once started, the demo is available at http://localhost:8793/demo/.