
JavaScript charts
StockSharp JS Trading Charts is a standalone, dependency-free browser charting library. It is published on npm as @stocksharp/chart and ships the sschart canvas engine used by the StockSharp web terminal. A working version is available in the live demo.
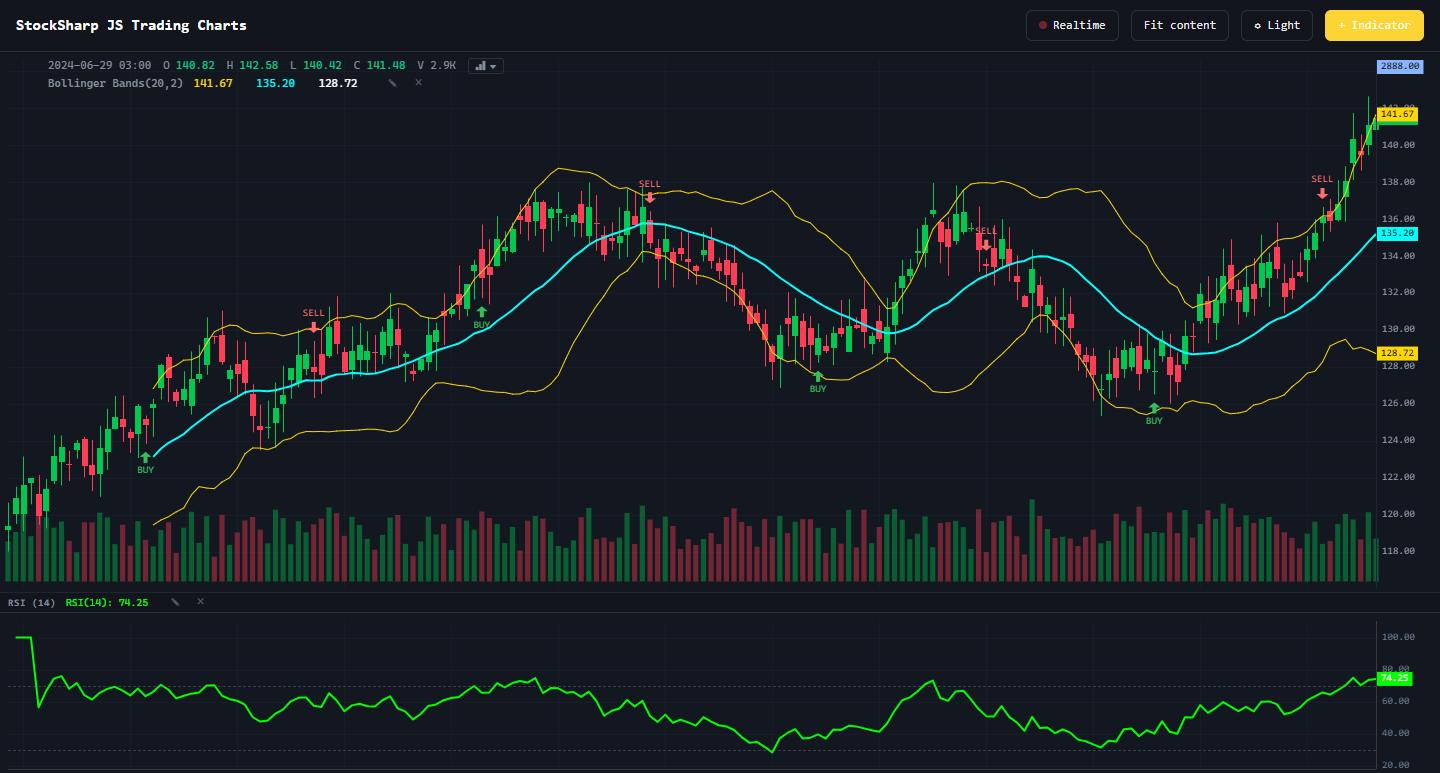
Unlike the Windows components from StockSharp.Xaml.Charting, this library runs in a browser and draws directly on an HTML canvas. The engine is exposed through the SSChart global (from dist/sschart.js) and can also be imported as ECMAScript modules from the npm package (import { createChart, CandlestickSeries } from '@stocksharp/chart').
Live demo
The chart below is the real engine running on this page — candles with a volume histogram and a moving average. Drag to scroll, use the wheel to zoom, and press the expand button (top-right) to open it full screen.
Capabilities
- A full set of price series: candlesticks, OHLC bars, line, area, histogram, band, plus the derived Heikin-Ashi, Renko and Point & Figure types.
- Exact order-flow studies: footprint, volume profile and TPO (market profile).
- Historical loading and real-time updates via
setDataandupdate. - Trade markers, price lines, crosshair, zooming, scrolling and automatic range calculation.
- An indicator engine with approximately 160 calculation implementations.
- Overlay indicators, synchronized oscillator panes and a crosshair-driven legend.
- Light and dark themes, a context menu, an indicator dialog and chart-type switching.
Installation
Install the package from npm and import the ES modules:
npm install @stocksharp/chart
import { createChart, CandlestickSeries } from '@stocksharp/chart';
Or, without a bundler, drop in the pre-built SSChart global with a <script> tag as shown below.
Adding a chart to a page
The build produces dist/sschart.js, which publishes window.SSChart. Time values passed to the API are Unix timestamps in seconds.
<div id="chart" style="width: 800px; height: 400px"></div>
<script src="dist/sschart.js"></script>
Create a chart, add a series and load the data:
const chart = SSChart.createChart(document.getElementById('chart'), {
  timeScale: { timeVisible: true },
  crosshair: { mode: SSChart.CrosshairMode.Normal },
});

const candles = chart.addSeries(SSChart.CandlestickSeries, {
  upColor: '#26a69a',
  downColor: '#ef5350',
  borderVisible: false,
});

candles.setData([
  { time: 1704153600, open: 120, high: 122, low: 119, close: 121 },
  { time: 1704240000, open: 121, high: 124, low: 120, close: 123 },
]);

candles.update({
  time: 1704326400,
  open: 123,
  high: 123.5,
  low: 122.8,
  close: 123.2,
});

chart.timeScale().fitContent();
Calling update with the current timestamp replaces the last point. A newer timestamp appends a point.
Chart modes
Each series type has its own topic with a live demo and the JavaScript that configures it:
- Candlestick — classic OHLC candles.
- OHLC bars — open/close ticks on a vertical range bar.
- Line — a single polyline through the closes.
- Area — a line with a gradient fill.
- Histogram — vertical bars, typically volume.
- Band — an upper/lower channel (envelopes, Bollinger).
- Heikin-Ashi — smoothed candles that filter noise.
- Renko — price-driven bricks, time-agnostic.
- Point and Figure — X/O columns of price movement.
- Footprint — bid × ask volume at every price inside each bar.
- Volume profile — volume-at-price with POC and value area.
- TPO (Market profile) — time spent at each price per session.
Beyond the series types, the chart also has an indicator engine with about 160 studies and lazy history backfill that loads older bars as you scroll.
For the visual strategy editor rendered by the same web stack, see JavaScript diagram.
Full terminal chart stack
The modules under src/chart extend the base engine with terminal features:
IndicatorEngine, indicator renderers, settings and the calculation catalog.- A chart-type switcher for candles, bars, lines, areas, Heikin-Ashi, Renko and Point & Figure.
- A legend, synchronized secondary panes, a context menu and an indicator selection dialog.
- Recalculation of active indicators when real-time data changes.
Use src/chart/app.ts as the integration example for the complete stack.
Building from source
Clone the repository and use the included npm scripts:
git clone https://github.com/StockSharp/Charts.git
cd Charts
npm install
npm run build
npm test
npm run serve
The development server serves the demo at http://localhost:8791/demo/index.html.