Quick Start
On first launch, Designer opens the preconfigured moving average strategy diagram.
To run it on historical data, you need to download the data in the correct format. We recommend using Hydra, a program designed for automatic market-data loading (instruments, candles, tick trades, order books, and other data) from different sources and storing it in local storage. Historical data download and storage are described in detail in Market data storage.
After the data is downloaded with Hydra, specify the directory where Hydra saved the history in Designer. This is configured on the Backtest -> Storage tab.
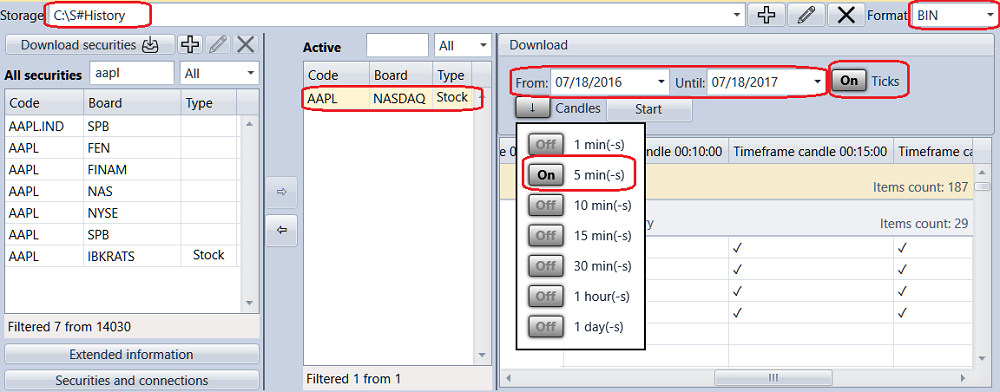
Clicking  opens the Data storage settings window, where you can configure local or remote storage. You can also configure Hydra in server mode as a market-data source. Clicking ![[Designer_Settings_Repository_button.png]] opens the folder selection window. Select the folder where you previously saved the history downloaded by Hydra.
Now get the instruments and their data from the configured local storage. Go to the Common tab and select the Market data component.
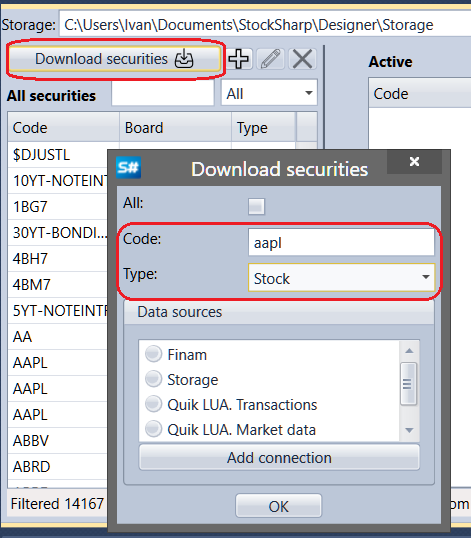
The market-data management tab opens. To get the available instruments, click Download instruments. To download an instrument, enter its code or select the All flag, choose the data source, and click OK. Designer requests the available instruments from the data source. All found instruments appear in the All instruments panel.
Now Designer can use the downloaded instruments and historical data available in storage. Choose one of the demo strategies. In the Schemas panel, open the Strategies folder and double-click the SMA sample strategy. The Sma tab appears in the workspace. After switching to the strategy, the ribbon automatically opens the Backtest tab, which contains the main controls for creating, debugging, and testing strategies (Creating strategies, Historical testing example).
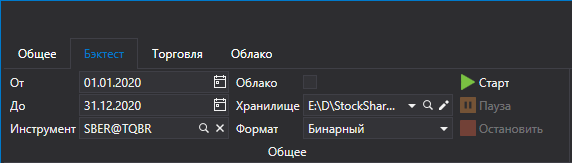
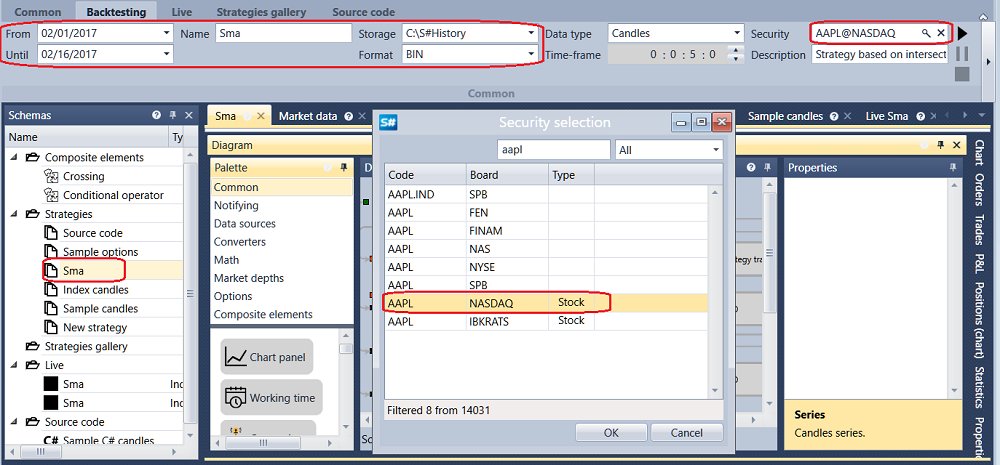
On the Backtest tab, set the testing period, select the instrument, and choose Market data storage.
Clicking  in the Instrument field opens the Select instrument window. Select the required instrument in this window.
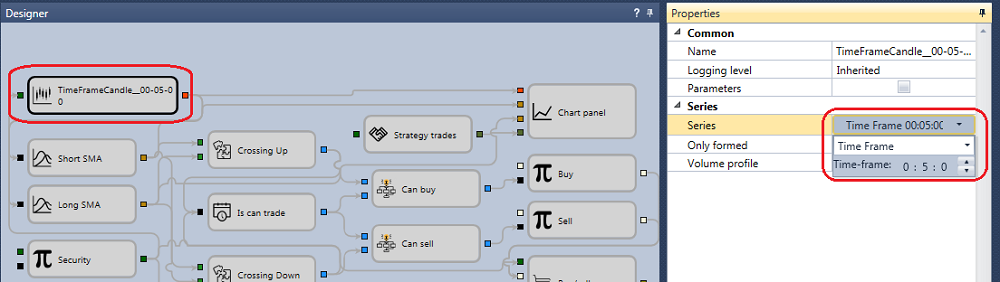
When you select any block on the Designer panel, the Properties panel shows that block's properties. In the Properties panel of the Candles block, you can configure the candle type and Time Frame (Candles).
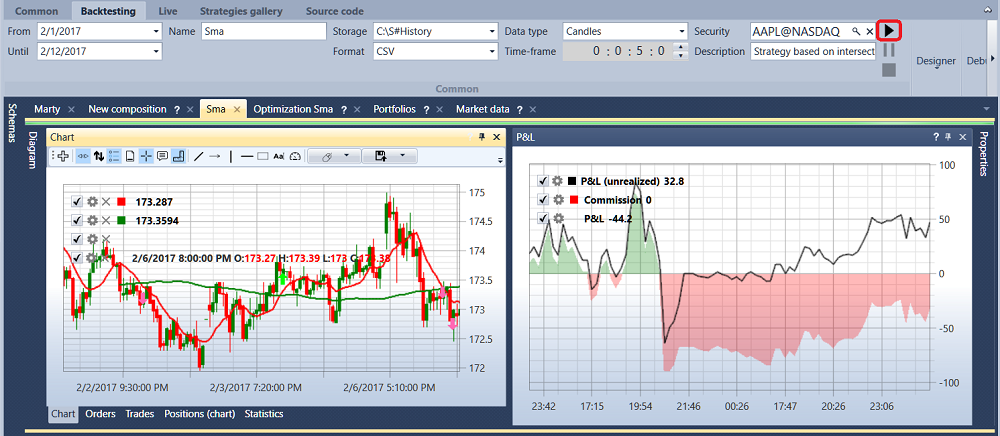
After clicking Start, trading emulation begins. The test results are available on the corresponding tabs of the diagram: Chart, Orders, Trades, P/L, Positions (chart), Statistics, and Positions.