Smile volatility
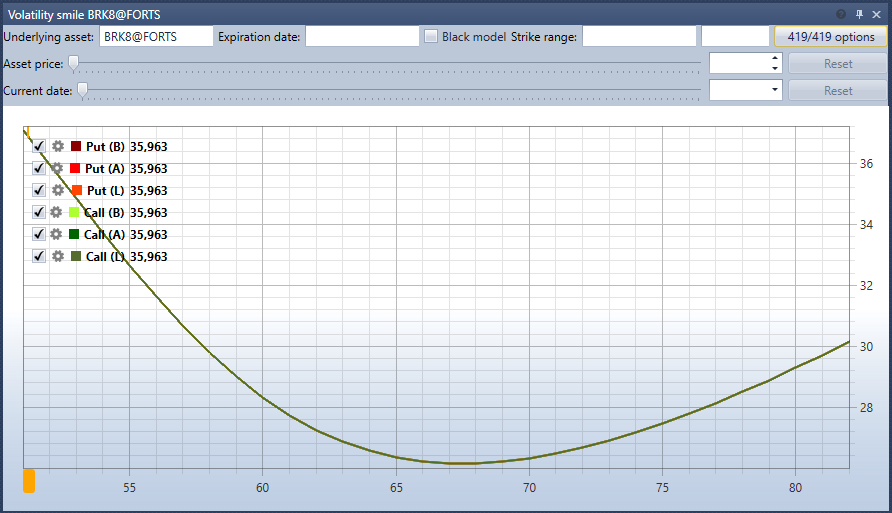
The Smile volatility component is a graphic representation of the expected volatility level for options with the same underlying asset and different strikes.
The options are selected with the same filter as on the option desk: the underlying asset, the expiration date, the strike range and the options themselves.
The chart has seven curves: the implied volatility of calls and puts by the best bid, by the best ask and by the last trade price, and, dashed, the Average of the call and put volatility at each strike. Under the chart is a table: Strike, the Call and Put volatility (by the last trade price, and if there were no trades, by the best bid or ask) and their Average.