
Footprint
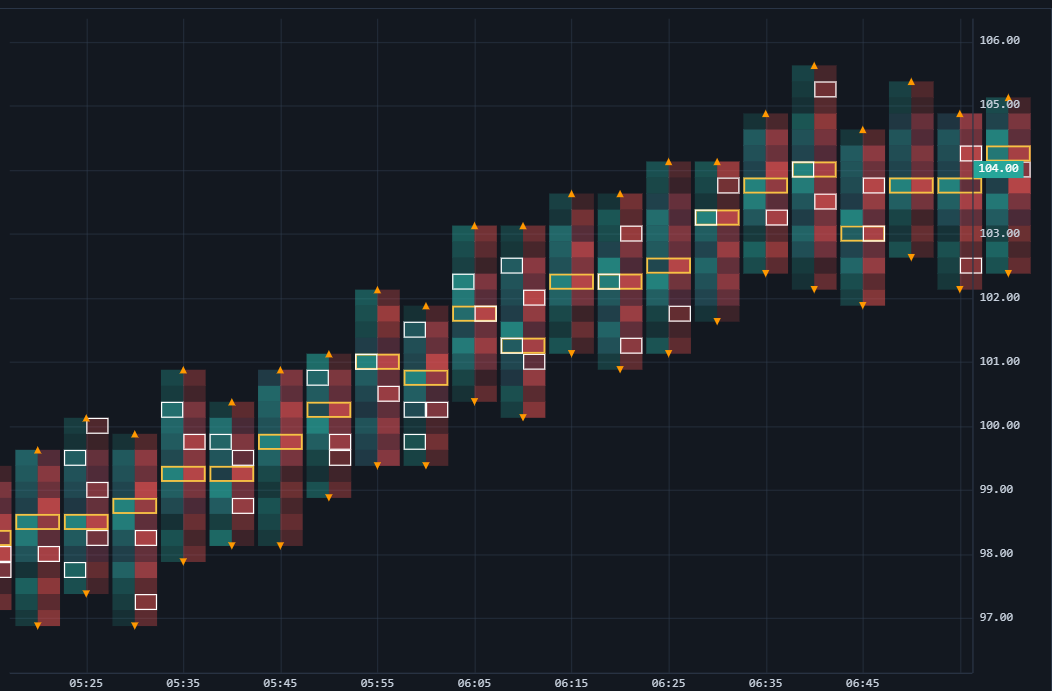
A footprint chart opens up each bar to show the volume traded at every price inside it, split into bid and ask. Imbalance coloring highlights where aggressive buyers or sellers dominated, which is the core of order-flow reading.
Live demo
Zoom in to read the individual cells — footprint is legible only a handful of bars at a time.
Setup
Add a FootprintSeries and feed it exact order-flow bars. Each bar carries dataMode: 'exact', its OHLC, and a levels array of { price, bidVolume, askVolume, tradeCount }:
const series = chart.addSeries(SSChart.FootprintSeries, {
  tickSize: 0.25,
  mode: SSChart.FootprintDisplayMode.BidAsk,       // BidAsk | Delta | Total | Ladder
  detailLevel: SSChart.FootprintDetailLevel.Auto,  // Auto | Numbers | Heatmap | Summary
  bidColor: '#26a69a',
  askColor: '#ef5350',
  showUnfinishedAuctions: true,
});

series.setData(exactBars);
mode chooses what each cell shows (bid × ask, delta, total or a ladder); detailLevel trades numeric detail for density as you zoom — Auto switches automatically.