
Volume profile
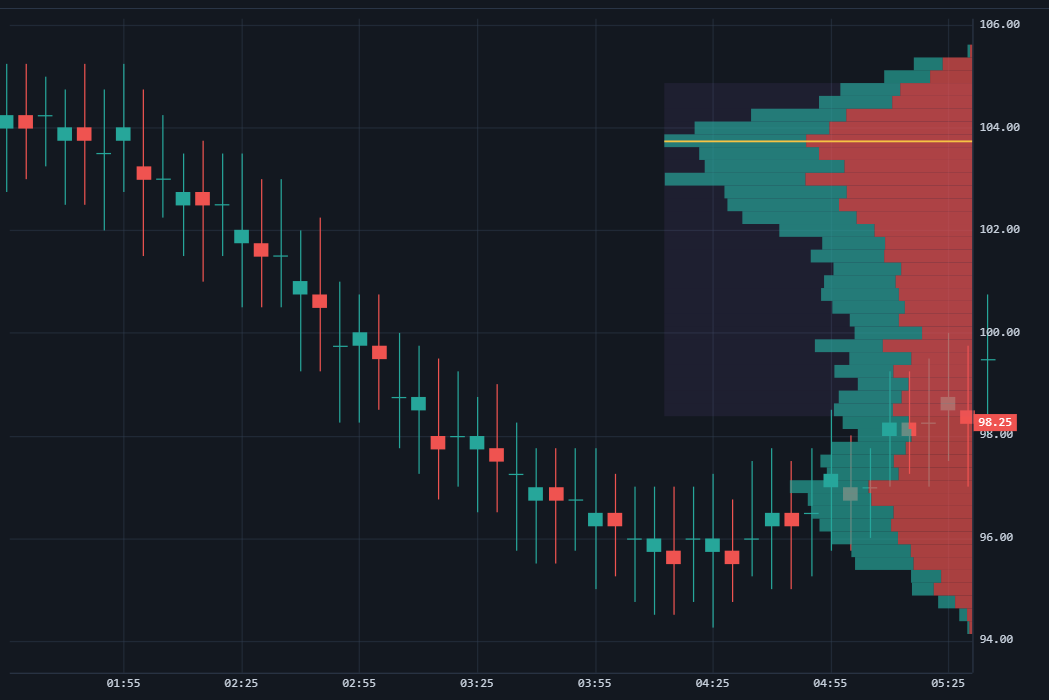
A volume profile aggregates traded volume by price and draws it as a horizontal histogram, marking the point of control (the most-traded price) and the value area. It answers "where did business get done", independent of when.
Live demo
The profile recomputes over whatever bars are in view — scroll and zoom to watch it change.
Setup
Add an ExactVolumeProfileSeries (usually over a candlestick series for context) and feed it the same exact order-flow bars used by the footprint:
const candles = chart.addSeries(SSChart.CandlestickSeries, {
  upColor: '#26a69a', downColor: '#ef5350', borderVisible: false,
});
candles.setData(exactBars);

const profile = chart.addSeries(SSChart.ExactVolumeProfileSeries, {
  tickSize: 0.25,
  rangeMode: SSChart.VolumeProfileRangeMode.Visible,     // Visible | Fixed | Session
  displayMode: SSChart.VolumeProfileDisplayMode.BidAsk,  // Total | BidAsk | Delta
  bidColor: '#26a69a',
  askColor: '#ef5350',
  showLabels: true,
  profileWidth: 0.32,
});
profile.setData(exactBars);

chart.timeScale().fitContent();
rangeMode sets what the profile covers: Visible recomputes over the viewport, Fixed pins one range, Session builds one profile per session.