
最大K线
最大K线 脚本用于在指定时间段内,从所选交易品种的图表中找出成交量最大以及实体最长的K线。该工具可帮助交易者和分析人员识别重要的市场事件及市场参与者的反应。
主要特点
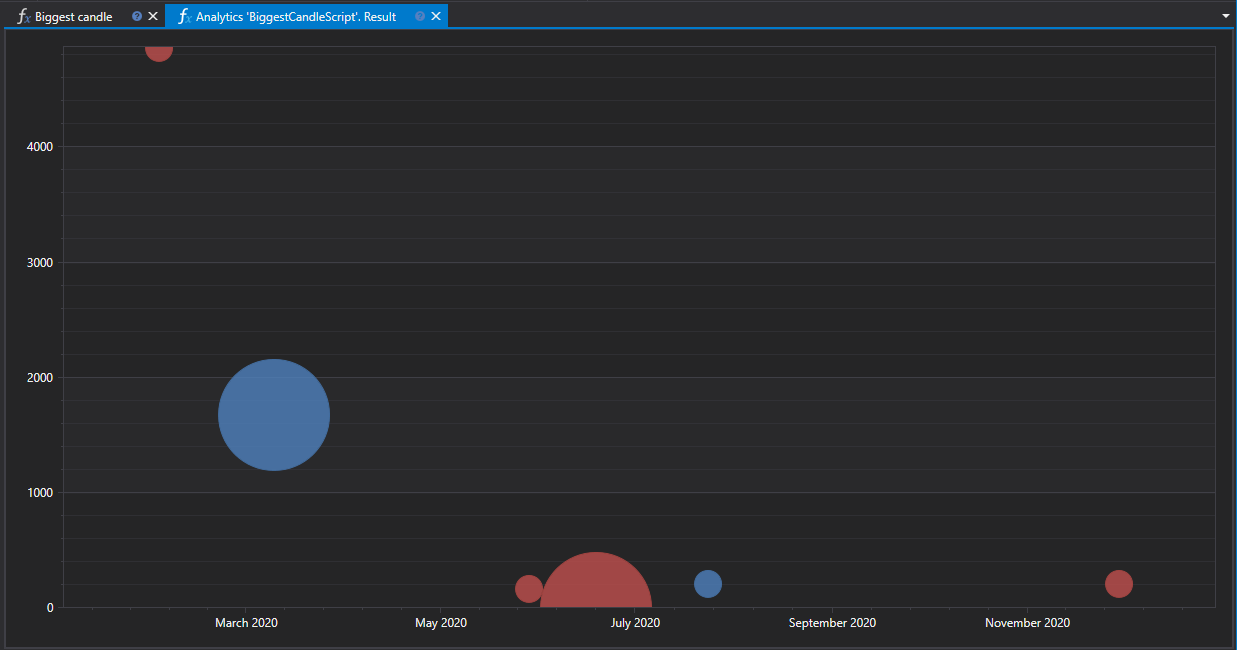
脚本分析一组指定交易品种,从中查找成交量最大和实体最长的K线,并将结果显示在两个图表中:
- K线实体长度图表:显示开盘价与收盘价之差最大的K线。
- 成交量图表:显示在各自K线周期内成交量最大的K线。
工作流程
- 选择交易品种和分析时段:确定要分析的交易品种列表及时间范围。
- 分析数据:加载并分析历史K线数据,找出各项指标最大的K线。
- 可视化结果:在分析面板的图表中显示找到的K线。
应用
- 市场活跃度分析:帮助确定交易者最活跃的时点以及潜在的市场反转。
- 识别关键价位:成交量较大且实体较长的K线通常出现在关键支撑位和阻力位附近。
- 策略规划:结合潜在波动性,利用最大K线的信息规划入场点和出场点。
C# 脚本代码
namespace StockSharp.Algo.Analytics
{
	/// <summary>
	/// 分析脚本,用于显示指定交易品种中按成交量和长度计算的最大 K线。
	/// </summary>
	public class BiggestCandleScript : IAnalyticsScript
	{
		Task IAnalyticsScript.Run(ILogReceiver logs, IAnalyticsPanel panel, SecurityId[] securities, DateTime from, DateTime to, IStorageRegistry storage, IMarketDataDrive drive, StorageFormats format, DataType dataType, CancellationToken cancellationToken)
		{
			if (securities.Length == 0)
			{
				logs.LogWarning("没有交易品种。");
				return Task.CompletedTask;
			}

			var priceChart = panel.CreateChart<DateTimeOffset, decimal, decimal>();
			var volChart = panel.CreateChart<DateTimeOffset, decimal, decimal>();

			var bigPriceCandles = new List<CandleMessage>();
			var bigVolCandles = new List<CandleMessage>();

			foreach (var security in securities)
			{
				// 如果用户取消脚本执行,则停止计算
				if (cancellationToken.IsCancellationRequested)
					break;

				// 获取 K线存储
				var candleStorage = storage.GetCandleMessageStorage(security, dataType, drive, format);

				var allCandles = candleStorage.Load(from, to).ToArray();

				// 按成交量降序排列后的首条记录就是最大K线
				var bigPriceCandle = allCandles.OrderByDescending(c => c.GetLength()).FirstOrDefault();
				var bigVolCandle = allCandles.OrderByDescending(c => c.TotalVolume).FirstOrDefault();

				if (bigPriceCandle != null)
					bigPriceCandles.Add(bigPriceCandle);

				if (bigVolCandle != null)
					bigVolCandles.Add(bigVolCandle);
			}

			// 在图表上绘制序列
			priceChart.Append("价格", bigPriceCandles.Select(c => c.OpenTime), bigPriceCandles.Select(c => c.GetMiddlePrice(null)), bigPriceCandles.Select(c => c.GetLength()));
			volChart.Append("价格", bigVolCandles.Select(c => c.OpenTime), bigPriceCandles.Select(c => c.GetMiddlePrice(null)), bigVolCandles.Select(c => c.TotalVolume));

			return Task.CompletedTask;
		}
	}
}
Python 脚本代码
import clr

# 添加 .NET 引用
clr.AddReference("StockSharp.Messages")
clr.AddReference("StockSharp.Algo.Analytics")
clr.AddReference("Ecng.Drawing")

from Ecng.Drawing import DrawStyles
from System.Threading.Tasks import Task
from StockSharp.Algo.Analytics import IAnalyticsScript
from storage_extensions import *
from candle_extensions import *
from chart_extensions import *
from indicator_extensions import *

# 分析脚本,用于显示指定交易品种中按成交量和长度计算的最大 K线。
class biggest_candle_script(IAnalyticsScript):
	def Run(self, logs, panel, securities, from_date, to_date, storage, drive, format, data_type, cancellation_token):
		if not securities:
			logs.LogWarning("没有交易品种。")
			return Task.CompletedTask

		price_chart = create_3d_chart(panel, datetime, float, float)
		vol_chart = create_3d_chart(panel, datetime, float, float)

		big_price_candles = []
		big_vol_candles = []

		if data_type is None:
			logs.LogWarning(f"不支持的数据类型 {data_type}。")
			return Task.CompletedTask

		message_type = data_type.MessageType

		for security in securities:
			# 如果用户取消脚本执行,则停止计算
			if cancellation_token.IsCancellationRequested:
				break

			# 获取 K线存储
			candle_storage = get_candle_storage(storage, security, data_type, drive, format)
			all_candles = load_range(candle_storage, message_type, from_date, to_date)

			if len(all_candles) > 0:
				# 按成交量降序排列后的首条记录就是最大K线
				big_price_candle = max(all_candles, key=lambda c: get_length(c))
				big_vol_candle = max(all_candles, key=lambda c: c.TotalVolume)

				if big_price_candle is not None:
					big_price_candles.append(big_price_candle)

				if big_vol_candle is not None:
					big_vol_candles.append(big_vol_candle)

		# 在图表上绘制序列
		price_chart.Append(
			"价格",
			[c.OpenTime for c in big_price_candles],
			[get_middle_price(c) for c in big_price_candles],
			[get_length(c) for c in big_price_candles]
		)

		vol_chart.Append(
			"价格",
			[c.OpenTime for c in big_vol_candles],
			[get_middle_price(c) for c in big_price_candles],
			[c.TotalVolume for c in big_vol_candles]
		)

		return Task.CompletedTask