Velas más grandes
El script "Velas más grandes" está diseñado para identificar velas con el volumen máximo y la mayor longitud de cuerpo en los gráficos de instrumentos financieros seleccionados durante un período dado. Esta herramienta permite a operadores y analistas identificar eventos de mercado significativos y la reacción de los participantes del mercado.
Funciones clave
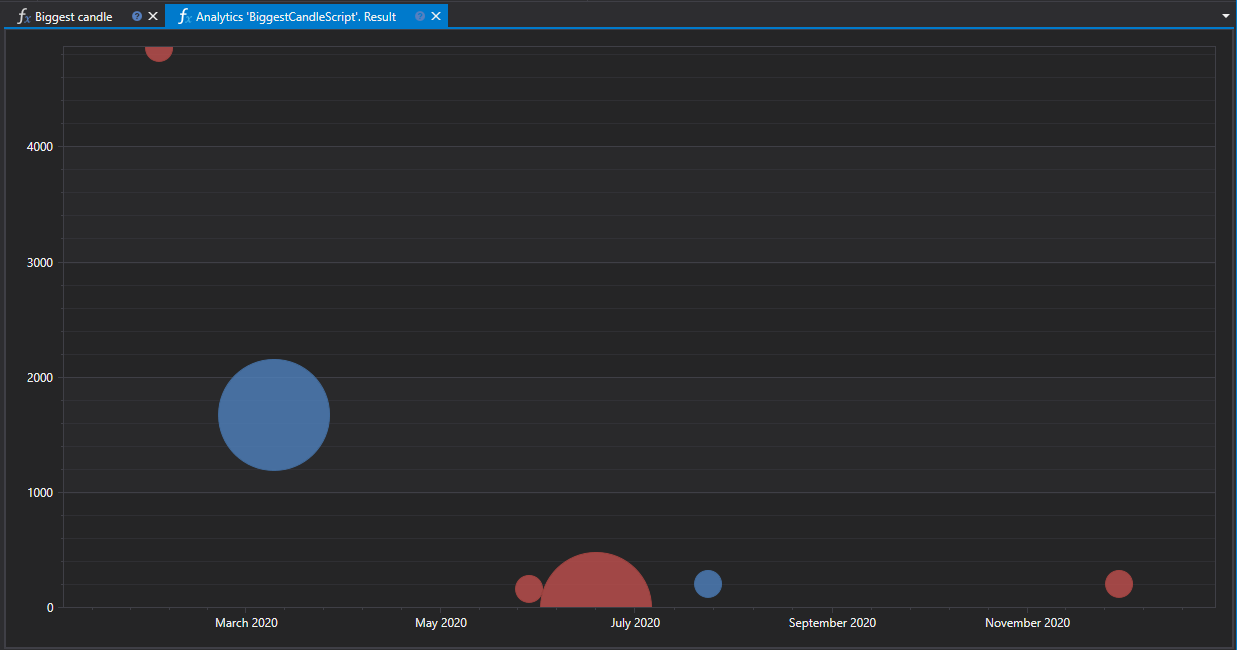
El script analiza un conjunto de instrumentos especificados, busca entre ellos velas con el mayor volumen y longitud de cuerpo, y muestra estos datos en dos gráficos:
- Gráfico de longitud del cuerpo de la vela: muestra velas con la mayor diferencia entre precio de apertura y cierre.
- Gráfico de volumen de negociación: muestra velas con el volumen máximo de negociación durante la existencia de la vela.
Flujo de trabajo
- Selección de instrumentos y período de análisis: determina la lista de instrumentos y el intervalo temporal para análisis.
- Análisis de datos: incluye cargar y analizar datos históricos de velas para identificar las velas con los mayores indicadores.
- Visualización de resultados: las velas encontradas se muestran en gráficos en la interfaz del panel de analítica.
Aplicación
- Análisis de actividad del mercado: ayuda a determinar momentos de mayor actividad de operadores y posibles reversos del mercado.
- Identificación de niveles clave: las velas con volumen y longitud de cuerpo significativos a menudo se forman alrededor de niveles clave de soporte y resistencia.
- Planificación estratégica: la información sobre las velas más grandes puede usarse para planificar puntos de entrada y salida del mercado, considerando la posible volatilidad.
Código del script en C#
namespace StockSharp.Algo.Analytics
{
	/// <summary>
	/// Script analítico que muestra la mayor vela (por volumen y longitud) para los instrumentos especificados.
	/// </summary>
	public class BiggestCandleScript : IAnalyticsScript
	{
		Task IAnalyticsScript.Run(ILogReceiver logs, IAnalyticsPanel panel, SecurityId[] securities, DateTime from, DateTime to, IStorageRegistry storage, IMarketDataDrive drive, StorageFormats format, DataType dataType, CancellationToken cancellationToken)
		{
			if (securities.Length == 0)
			{
				logs.LogWarning("No hay instrumentos.");
				return Task.CompletedTask;
			}

			var priceChart = panel.CreateChart<DateTimeOffset, decimal, decimal>();
			var volChart = panel.CreateChart<DateTimeOffset, decimal, decimal>();

			var bigPriceCandles = new List<CandleMessage>();
			var bigVolCandles = new List<CandleMessage>();

			foreach (var security in securities)
			{
				// detener el cálculo si el usuario cancela la ejecución del script
				if (cancellationToken.IsCancellationRequested)
					break;

				// obtener almacenamiento de velas
				var candleStorage = storage.GetCandleMessageStorage(security, dataType, drive, format);

				var allCandles = candleStorage.Load(from, to).ToArray();

				// la primera ordenada por volumen descendente será nuestra vela más grande
				var bigPriceCandle = allCandles.OrderByDescending(c => c.GetLength()).FirstOrDefault();
				var bigVolCandle = allCandles.OrderByDescending(c => c.TotalVolume).FirstOrDefault();

				if (bigPriceCandle != null)
					bigPriceCandles.Add(bigPriceCandle);

				if (bigVolCandle != null)
					bigVolCandles.Add(bigVolCandle);
			}

			// dibujar series en el gráfico
			priceChart.Append("precios", bigPriceCandles.Select(c => c.OpenTime), bigPriceCandles.Select(c => c.GetMiddlePrice(null)), bigPriceCandles.Select(c => c.GetLength()));
			volChart.Append("precios", bigVolCandles.Select(c => c.OpenTime), bigPriceCandles.Select(c => c.GetMiddlePrice(null)), bigVolCandles.Select(c => c.TotalVolume));

			return Task.CompletedTask;
		}
	}
}
Código del script en Python
import clr

# Añadir referencias .NET
clr.AddReference("StockSharp.Messages")
clr.AddReference("StockSharp.Algo.Analytics")
clr.AddReference("Ecng.Drawing")

from Ecng.Drawing import DrawStyles
from System.Threading.Tasks import Task
from StockSharp.Algo.Analytics import IAnalyticsScript
from storage_extensions import *
from candle_extensions import *
from chart_extensions import *
from indicator_extensions import *

# Script analítico que muestra la mayor vela (por volumen y longitud) para los instrumentos especificados.
class biggest_candle_script(IAnalyticsScript):
	def Run(self, logs, panel, securities, from_date, to_date, storage, drive, format, data_type, cancellation_token):
		if not securities:
			logs.LogWarning("No hay instrumentos.")
			return Task.CompletedTask

		price_chart = create_3d_chart(panel, datetime, float, float)
		vol_chart = create_3d_chart(panel, datetime, float, float)

		big_price_candles = []
		big_vol_candles = []

		if data_type is None:
			logs.LogWarning(f"Tipo de datos no admitido {data_type}.")
			return Task.CompletedTask

		message_type = data_type.MessageType

		for security in securities:
			# detener el cálculo si el usuario cancela la ejecución del script
			if cancellation_token.IsCancellationRequested:
				break

			# obtener almacenamiento de velas
			candle_storage = get_candle_storage(storage, security, data_type, drive, format)
			all_candles = load_range(candle_storage, message_type, from_date, to_date)

			if len(all_candles) > 0:
				# la primera ordenada por volumen descendente será nuestra vela más grande
				big_price_candle = max(all_candles, key=lambda c: get_length(c))
				big_vol_candle = max(all_candles, key=lambda c: c.TotalVolume)

				if big_price_candle is not None:
					big_price_candles.append(big_price_candle)

				if big_vol_candle is not None:
					big_vol_candles.append(big_vol_candle)

		# dibujar series en el gráfico
		price_chart.Append(
			"precios",
			[c.OpenTime for c in big_price_candles],
			[get_middle_price(c) for c in big_price_candles],
			[get_length(c) for c in big_price_candles]
		)

		vol_chart.Append(
			"precios",
			[c.OpenTime for c in big_vol_candles],
			[get_middle_price(c) for c in big_price_candles],
			[c.TotalVolume for c in big_vol_candles]
		)

		return Task.CompletedTask