Gráfico
El componente Gráfico permite dibujar velas e indicadores para el instrumento seleccionado.
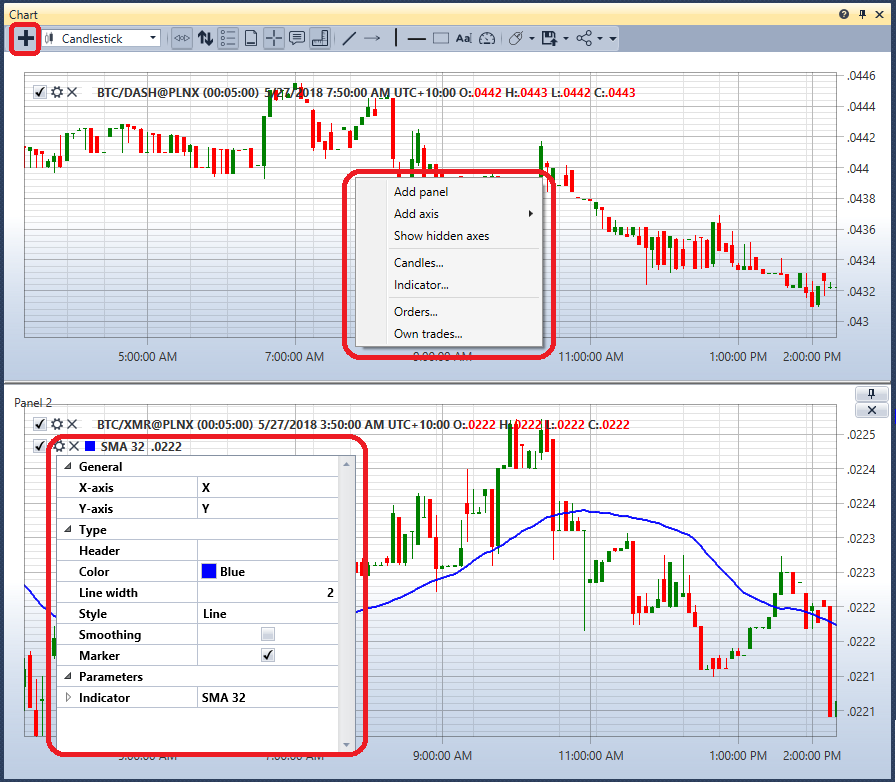
Para añadir una nueva área, haga clic en el botón  .
.
Para añadir un nuevo elemento al gráfico, haga clic derecho en cualquier lugar del área del gráfico y seleccione el elemento requerido; las opciones disponibles incluyen velas, indicadores, órdenes y operaciones propias.
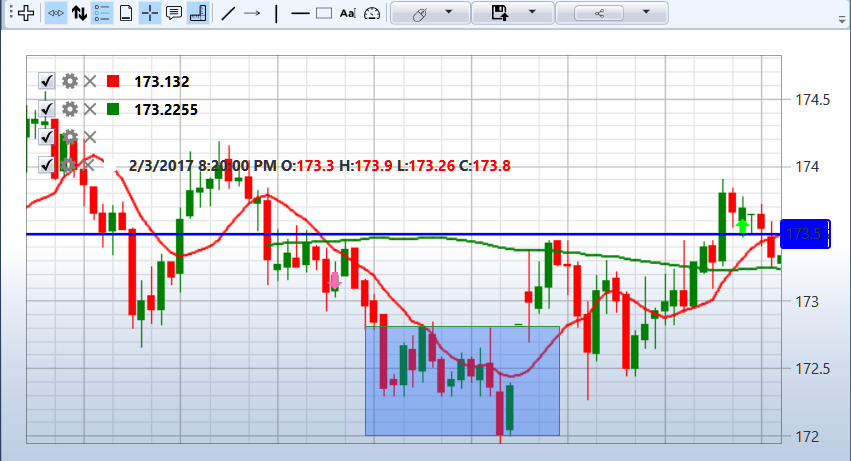
La esquina superior izquierda de cada gráfico muestra todos los elementos gráficos añadidos al gráfico. Si desmarca la casilla  de un elemento gráfico, ese elemento también se elimina del gráfico.
Al hacer clic en  , se abre la configuración del elemento gráfico.
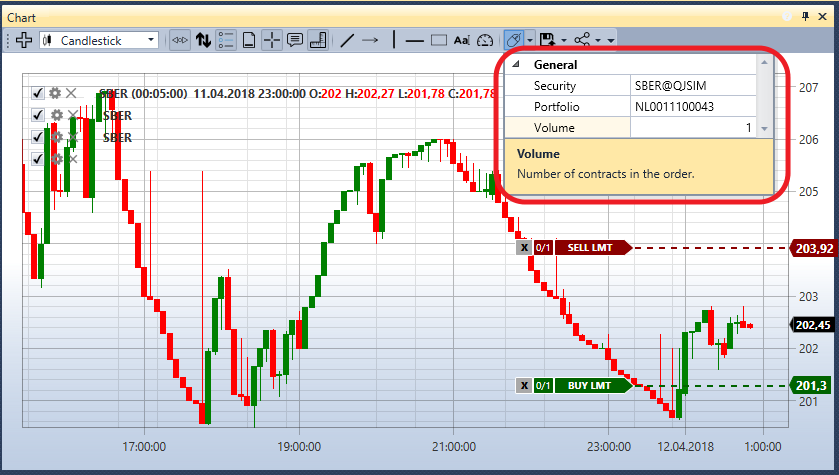
Puede registrar órdenes desde el gráfico. Para ello, primero especifique el Instrumento y la Cartera para los que se registrarán las órdenes.
Las órdenes de compra se registrarán con la combinación de teclas Ctrl+botón izquierdo del ratón.
Las órdenes de venta se registrarán con la combinación de teclas Ctrl+botón derecho del ratón.
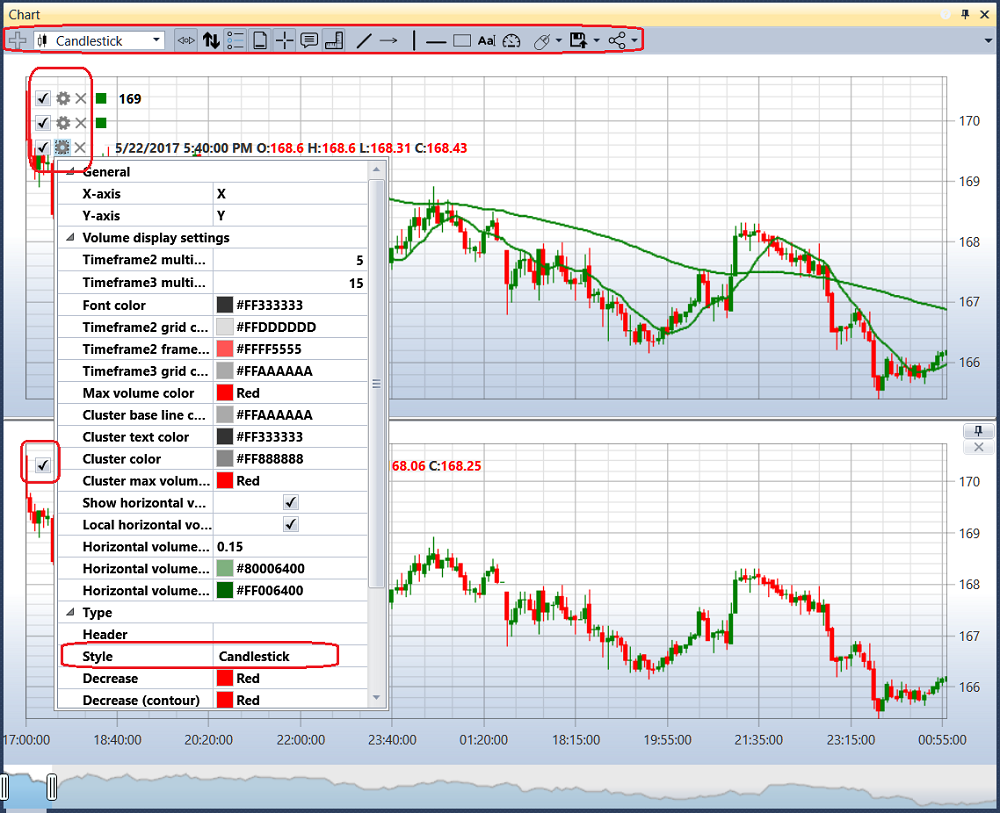
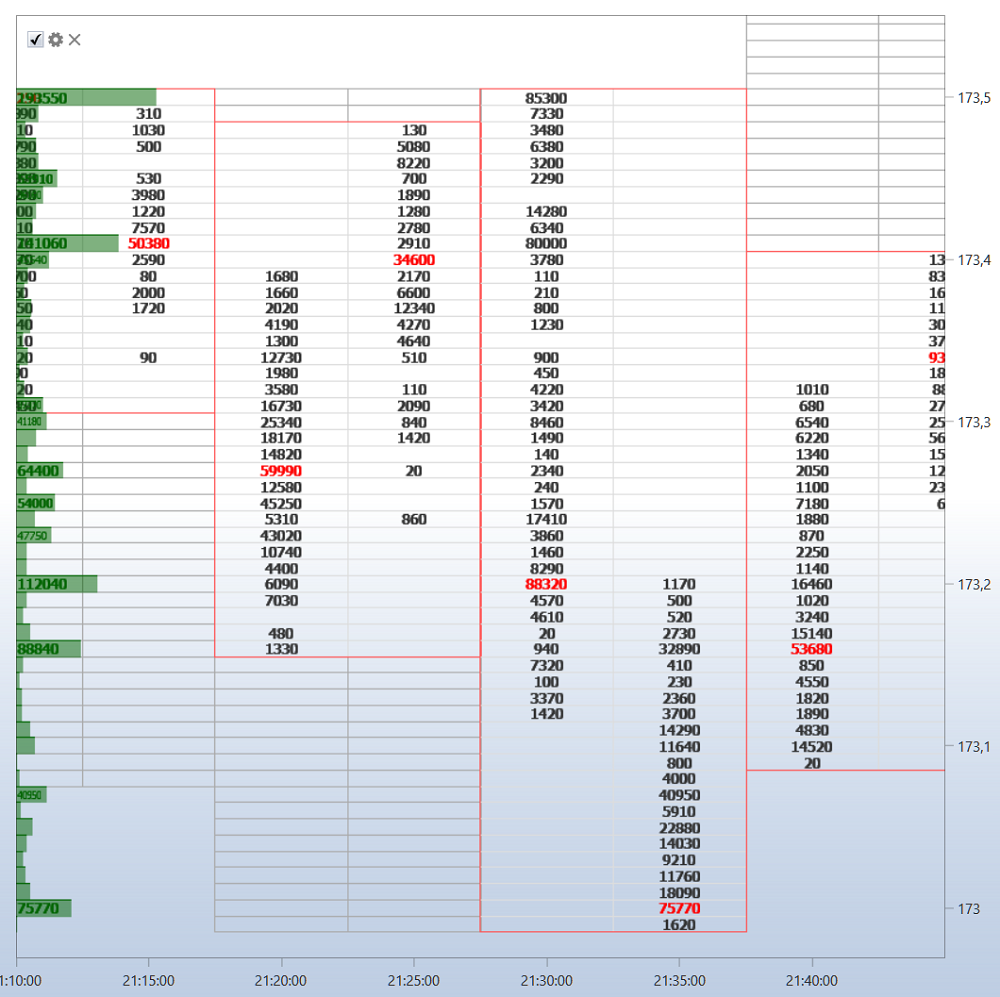
En la configuración del elemento gráfico, puede establecer el estilo de gráfico requerido: velas japonesas, barras, gráfico Box, perfil de clúster, etc.
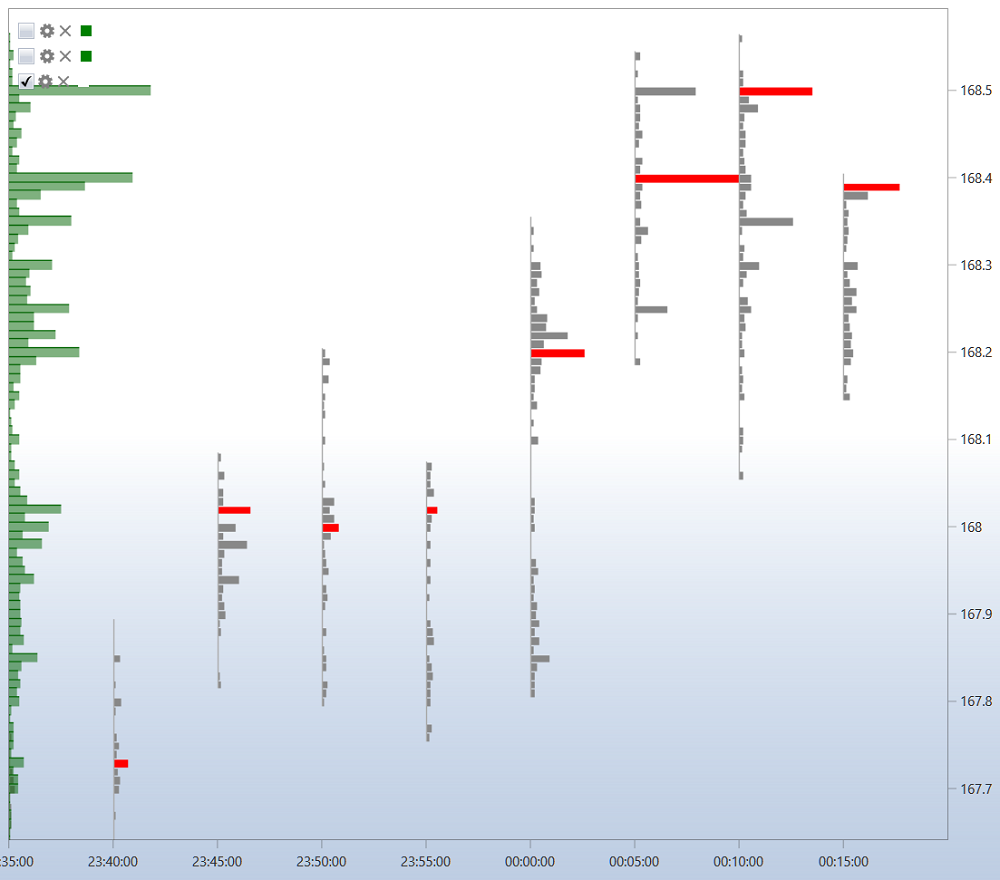
Para un gráfico Box, las velas también se pueden agrupar; el orden de agrupación se establece en los campos: multiplicador del segundo marco temporal y multiplicador del tercer marco temporal.
Sobre el gráfico hay una barra de herramientas donde puede seleccionar desplazamiento automático, zoom automático, modos de leyenda y otros ajustes generales del gráfico. También puede seleccionar los elementos que se dibujarán en el gráfico: líneas, niveles, punteros, rectángulo, texto.