
Equity curve
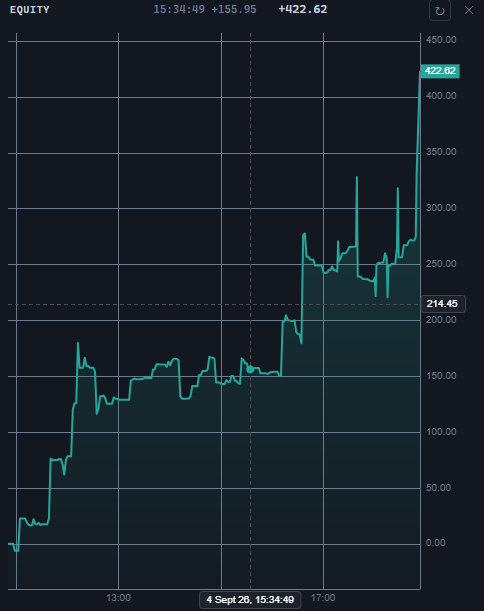
EquityWidget draws the cumulative P&L of a run as a chart over time. The panel is registered under the equity identifier (ControlTypes.Equity), and the curve itself is built by the @stocksharp/chart engine, which is wired in as a peer dependency.
Creating and updating
import {
  EquityWidget,
  type PnlPoint,
  type TradingHost,
} from '@stocksharp/trading-controls';

declare const host: TradingHost;

const equity = EquityWidget.create(
  document.querySelector<HTMLElement>('#equity')!,
  {},
  { host },
);

const start = Date.now() - 3 * 60 * 60 * 1000;

const points: PnlPoint[] = [
  { time: start, value: 0 },
  { time: start + 45 * 60 * 1000, value: 320.5 },
  { time: start + 95 * 60 * 1000, value: -140.25 },
  { time: Date.now(), value: 1_180.75 },
];

equity.update(points);
The only EquityDeps dependency is host; the panel has no action handlers, because there is nothing to execute on a curve. The second argument of create — the saved instance state — is not used by the control: the panel keeps no settings of its own, neither in the state nor in host.preferences.
update replaces the run as a whole. The curve value is cumulative, so a set of points without a previously passed sample counts as a different run rather than a continuation of the previous one.
Data and drawing
The time field of PnlPoint is in unix milliseconds; the engine counts time in seconds, and the control does the conversion itself. Points are sorted by time, samples with a non-numeric time or value are dropped, and out of several values within the same second the last one survives — it is the one that shows where the run actually stood at that moment.
While there are fewer than two usable points, the panel shows the message under the NoEquity key, no chart is created, and chart() returns null. The chart itself is built on the first drawing rather than in the constructor: the engine needs a container that is already laid out on the page. Size changes of the area are watched by a ResizeObserver, which calls the engine's resize.
The colors, the font, and the grid color come from host.presentation.canvasPalette(). The curve is colored by the last value of the run: up when the value is at or above zero, down when it is negative; the fill under the line is the same color, muted to 28 % at the top and 2 % at the bottom. The time axis shows hours and seconds in the browser time zone, or in UTC when Intl is unavailable.
Header, tooltip, and buttons
The panel header shows the last value of the run in the formatPnl format — with a sign and two decimals; the color class is returned by host.presentation.pnlClass. Above the curve, the value under the pointer is shown: the moment in words from host.presentation.timeText, and the value itself next to it. When the pointer leaves the chart, the tooltip is cleared.
The header button with the ResetView tooltip calls resetZoom, and the close button calls host.close(). The panel gets its visible text under the Equity, ResetView, ClosePanel, PnLChart, and NoEquity keys.
The control is responsible for the shape of the curve, its color, and its scale. What is left to the host is the language of the captions, the palette, the time format, and the source of the points themselves: the control does not compute P&L and requests data from nowhere.
Public methods
EquityWidget.create(hostEl, state, deps)— create the panel and add its root element to the container.EquityWidget.TYPE— theequityidentifier.update(points)— show the run as a whole.resetZoom()— return to the view of the whole run after zooming.chart()— theIChartApiinstance, so the host can draw its own additions: a benchmark line, a drawdown mark. Returnsnulluntil the chart appears.dispose()— disconnect the size observer, remove the chart, and unregister from the host.
The rootEl property gives the root element of the panel.
Wiring in the chart engine
The @stocksharp/chart package is installed separately:
npm install @stocksharp/chart
The ready-made sstradingcontrols.js bundle does not include the engine, so on a page without a bundler its scripts are added alongside:
<script src="https://cdn.jsdelivr.net/npm/@stocksharp/indicators/dist/ssindicators.js"></script>
<script src="https://cdn.jsdelivr.net/npm/@stocksharp/chart/dist/sschart.js"></script>