
Optimization surface
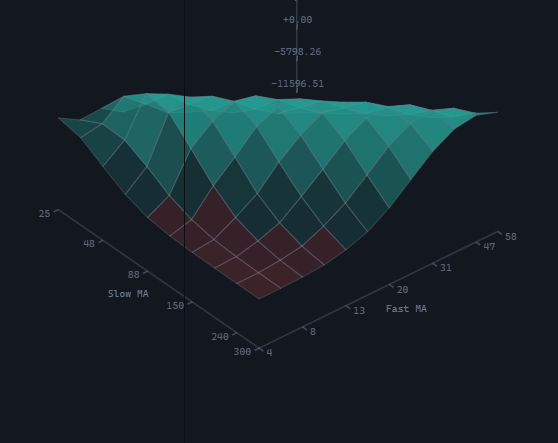
SurfaceWidget shows the results of a parameter sweep as a three-dimensional landscape: one metric over two discrete axes, where the value of the metric sets both the height and the color. The control takes the same data as the optimization heatmap, so one set of results can be shown as a flat map, as a surface, or as both at once.
Creating and updating
import {
  HeatDirections,
  SurfaceWidget,
  type SurfaceData,
  type TradingHost,
} from '@stocksharp/trading-controls';

declare const host: TradingHost;

const surface = SurfaceWidget.create(
  document.querySelector<HTMLElement>('#surface')!,
  {},
  { host },
);

const sweep: SurfaceData = {
  xLabel: 'Fast',
  yLabel: 'Slow',
  metricLabel: 'Net profit',
  betterWhen: HeatDirections.Higher,
  cells: [
    { x: '10', y: '50', value: 1_250 },
    { x: '10', y: '80', value: -320 },
    { x: '20', y: '50', value: 2_480 },
    { x: '20', y: '80', value: 640 },
  ],
};

surface.update(sweep);
The only dependency is host; the SurfaceDeps interface holds no other fields. The second argument of create is the saved instance state: the surface neither reads it nor writes anything into it.
update replaces the whole set at once. A surface is one sweep run, so it has no partial update: half of one run on top of half of another would give a landscape made of two different reports.
The static SurfaceWidget.TYPE property equals ControlTypes.OptimizationSurface — the optimizationSurface identifier.
Data
A HeatCell is a pair of axis values and the measured metric: { x, y, value }. The axis values are strings because the axis is discrete: 10, 00:05:00, and True are equally valid positions on it. Numeric values are ordered as numbers and the rest as text, so a sweep over 5, 8, 12, 40 stays a sequence.
The betterWhen field is mandatory and takes HeatDirections.Higher or HeatDirections.Lower. Without it a drawdown landscape would raise the worst corner into the peak.
Several runs on one pair collapse into an average — that is one cell. A pair the sweep did not visit stays a hole: a face is drawn only when all four of its corners are known, and a gap is not interpolated — a missing result is not a zero one. If there are no cells at all, or at least one axis has fewer than two distinct values, a placeholder with the text under the NoOptimizationResults key is shown instead of the landscape.
The xLabel, yLabel, and metricLabel captions go into the axis captions; metricLabel is additionally shown in the panel header.
Presentation
The height of a face is the position of the value relative to the reference point of the scale, folded into the range from the floor to the top: the reference point falls at mid-height, so the floor means not "the worst result" but the lower edge of the scale. The color comes from host.presentation.canvasPalette(): up for values better than the reference point, down for worse ones, with the saturation growing with the distance from it. Faces are filled from the far ones to the near ones, so the near ridge covers what lies behind it, and they are outlined in the grid color so that the mesh reads where two neighbouring faces are almost the same shade.
The projection is orthographic: a surface is read by comparing heights across the whole field, and perspective would shorten the far side of a ridge relative to the near one.
Two floor edges and the vertical axis of the scale are drawn under the landscape. The parameter axes carry up to eight ticks: while the values fit, all of them, then every second one, every third one, and so on, with the first and the last always captioned. The vertical axis carries five ticks, captioned with the values of the metric. Captions move to whichever floor edges are closer to the viewer — this is recomputed on rotation so that the numbers do not end up on top of the mesh.
View and gestures
All gestures arrive through pointer events, so mouse, pen, and finger follow one path:
- dragging with one pointer rotates the surface: horizontally it changes
yaw, verticallypitch; - two pointers change the scale by the distance between them; rotation stays with a single pointer;
- the wheel changes the scale too. The delta is reduced to "clicks" no matter whether the browser reported it in pixels, lines, or pages, and is limited to two clicks per event so that a mouse and a trackpad give a comparable step.
The control claims a gesture over the canvas for itself, otherwise dragging on a phone and the wheel on a desktop browser would scroll the page instead of the landscape.
Tilt and scale are bounded: pitch runs from MIN_PITCH (0.12) to MAX_PITCH (1.45), and the scale from 0.4 to 4. At zero tilt every face would degenerate into a line, and at a right angle the surface would become a flat map, that is, a different control. The yaw rotation is not bounded but wraps around: turning the landscape all the way round to look at the back slope of a ridge is a meaningful gesture. The initial view is DEFAULT_VIEW; the button in the panel header (ResetView) returns to it.
When the pointer is not rotating the surface, the control looks for the nearest measured point within a radius of 22 CSS pixels. The point found is circled with a ring in the up color, and a line appears in the strip above the canvas: the value on the xLabel axis, the value on the yLabel axis, and the metric. The strip lies over the canvas rather than in the panel header: the reading belongs to the point under the pointer and must be next to it. A pair the sweep did not visit is not offered to the pointer; at an equal distance the point closer to the viewer wins.
What the control does and what is left to the host
The control handles the gestures itself, watches the canvas size through ResizeObserver and redraws the landscape for the current size and screen pixel density, serves the view reset button and the panel close button that calls host.close(), and registers itself through host.register, unregistering in dispose. The canvas colors and font come from host.presentation.canvasPalette(). All visible text is requested through host.t: OptimizationSurface, ResetView, ClosePanel, OptimizationSurfaceChart, NoOptimizationResults.
The host supplies the data: the control does not start the optimization, does not subscribe to its progress, and does not know how the results were obtained — what is passed to update is what gets drawn. There is no click on a face: a face corresponds to a cell rather than to a single run, so there is nothing to open through it — a press rotates the landscape.
The control keeps no settings of its own in host.preferences, has no keys there, and never calls host.persistState. The current view is available through the view() method — if it has to be restored between sessions, the host saves and returns these values itself.
Public methods
update(data)— show the set of results as a whole.view()— return a copy of the current view (yaw,pitch,zoom).resetView()— return the view toDEFAULT_VIEW.dispose()— disconnect the size observer, callhost.unregister, and remove the root element.
Helper functions
The geometry is moved out of the control into a separate module and exported by the package — your own drawing can be built on it:
surfaceLayout(input)— lay the cells out into faces, axes, and vertices for the given size and view;nullwhen there is nothing to draw.project(nx, ny, nz, view, box)— project a point of the unit cube onto the canvas.dragView(view, dx, dy)— the view after dragging by that many pixels.zoomView(view, factor)— the view after a scale change.clampView(view)— the view brought within the allowed bounds.DEFAULT_VIEW,MIN_PITCH,MAX_PITCH— the initial view and the tilt bounds.