
Chart UI layer
createChartUi assembles a ready-made interface around the engine: pane headers, a legend with the crosshair readout, a context menu, a chart type menu, and the indicator dialog. The engine only draws; everything around it lives in a separate @stocksharp/chart/ui entry point — a page with a single sparkline does not pay for it.
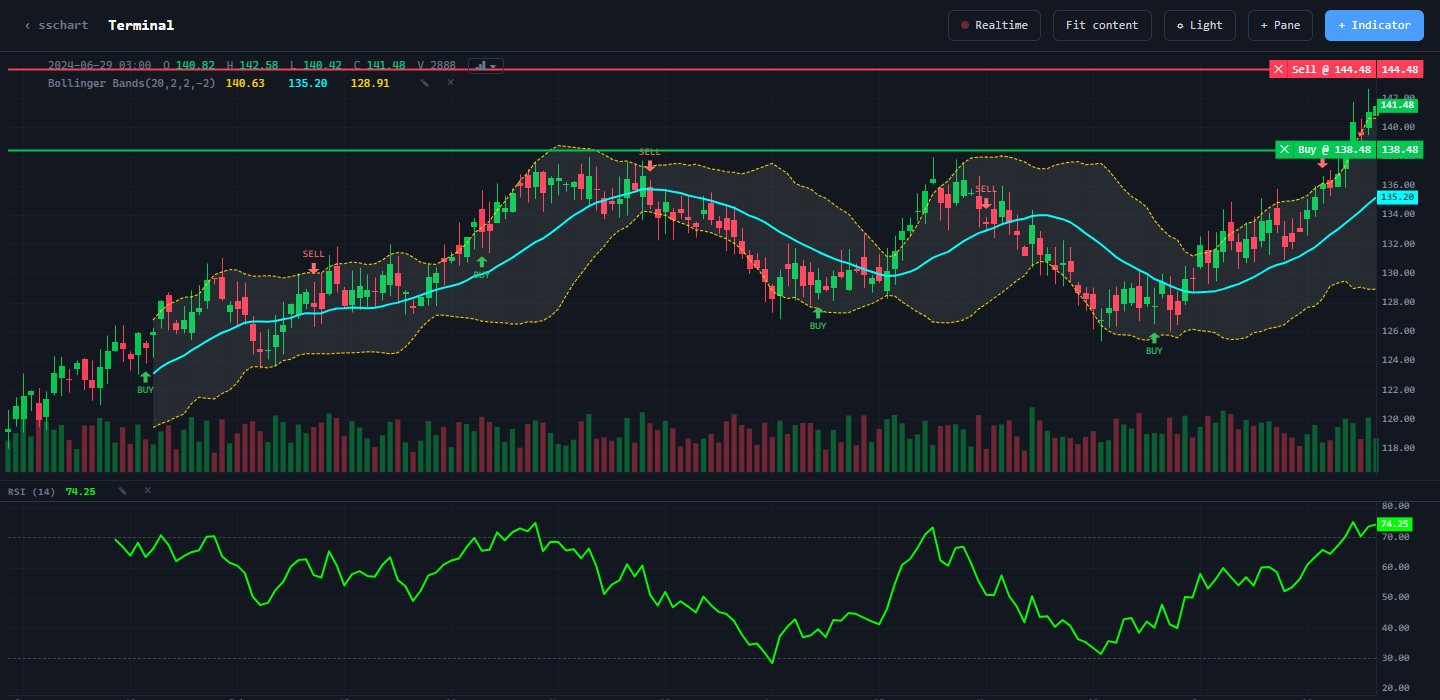
Wiring in
The layer ships as a separate package subpath and needs its own stylesheet:
import { createChartUi, standaloneHost } from '@stocksharp/chart/ui';
import '@stocksharp/chart/ui.css';
Without a bundler, add the browser bundle dist/sschartui.js — it publishes the global SSChartUI object. It must be loaded after dist/sschart.js: the layer reads the engine from the global object that file publishes rather than carrying a second copy of it.
Creating and updating
The layer needs the element the chart was created in, the page host, a price source for the context menu, and the list of chart types for the legend menu:
import { createChart, CandlestickSeries } from '@stocksharp/chart';
import {
  ChartType,
  createChartUi,
  localChartUiStorage,
  standaloneHost,
  type ChartUi,
} from '@stocksharp/chart/ui';
import '@stocksharp/chart/ui.css';

declare const candles: { time: number; open: number; high: number; low: number; close: number; volume?: number }[];

const container = document.querySelector<HTMLElement>('#chart')!;

const chart = createChart(container, { timeScale: { timeVisible: true } });
const series = chart.addSeries(CandlestickSeries, { upColor: '#26a69a', downColor: '#ef5350' });
series.setData(candles);

const ui: ChartUi = createChartUi(chart, {
  container,
  host: standaloneHost,
  priceSource: series,
  chartTypes: [
    { value: ChartType.Candle, label: 'Candles', icon: 'bi bi-bar-chart-fill' },
    { value: ChartType.Line, label: 'Line', icon: 'bi bi-graph-up' },
  ],
  storage: localChartUiStorage('sschart'),
});

ui.setCandles(candles);
setCandles is called again on every change of the candle window — a new instrument, a switched chart type, an arrived page of history. One call updates both the indicator engine and the legend.
The createChartUi options:
| Option | Purpose |
|---|---|
container |
The element the chart was created in; the panes are built around it. |
host |
Translation, formatting, and notifications. |
priceSource |
Pixel → price for the context menu. |
chartTypes |
The chart type menu items in display order; an empty list draws no menu. |
storage |
Where favourite indicators and templates are kept. In memory by default. |
dialogRoot |
Your own markup for the indicator dialog. Without it the markup is built and appended to body. |
modal |
Your own implementation of opening and closing the dialog. |
provideItems |
The page's own rows in the context menu — above the layer's own rows. |
What createChartUi returns
The result is the same objects, already wired together; any of them can be reached directly.
| Field | What it is |
|---|---|
engine |
IndicatorEngine — indicator computation and lifecycle. |
renderer |
IndicatorRenderer — the series the indicator outputs are drawn with. |
paneManager |
ChartPaneManager — pane headers, their menus, and restoration. |
legend |
ChartLegend — the OHLCV row and the indicator values under the crosshair. |
dialog |
IndicatorDialog — the catalog, search, parameters, and active indicators. |
menu |
ChartContextMenu — the right-click menu. |
indicators |
IndicatorController — undoable editing of already added indicators. |
templates |
IndicatorTemplateController — portable templates of indicator settings. |
Public methods
setCandles(candles)— pass the current candle window to the indicator engine and the legend.showIndicators()— open the indicator dialog.dispose()— remove the menu, dialog, legend, and panes; the dialog markup the layer created is deleted.
Page host
No module of the layer touches global objects: words, numbers, and notifications come from ChartUiHost — an object with the translate, formatters, and notify fields.
import { consoleNotify, createTranslate, defaultChartFormatters, type ChartUiHost } from '@stocksharp/chart/ui';

const host: ChartUiHost = {
  translate: createTranslate({ 'Indicators': 'Indicators', 'Add indicator…': 'Add indicator…' }),
  formatters: { ...defaultChartFormatters, price: value => value.toFixed(2) },
  notify: consoleNotify,
};
The dictionary is flat and keyed by the English source text: an unanswered key returns itself, that is, a readable English string rather than a missing-translation marker. Substitution is positional — {0}, {1}.
standaloneHost— a host that answers for everything itself: English text, formatting by the magnitude of the number, notifications to the console.identityTranslate— translation for a single-language page; placeholder substitution is kept.defaultChartFormatters—price,volume, andtime(Unix seconds,YYYY-MM-DD HH:MMformat).consoleNotify— notifications to the browser console; thesuccess,info,warning,errorlevels.createPlainModalController(root)— opening and closing the dialog for a page without a modal library of its own: a backdrop and closing onEscape. A click outside the window does not close the dialog.
Storage
Favourite indicators and templates are saved through ChartUiStorage — two functions, load(key) and save(key, value).
inMemoryChartUiStorage— the default: the data lives as long as the page does.localChartUiStorage(prefix)— a wrapper overlocalStoragewith a prefix, so that two charts on a page do not overwrite each other's favourites.
Chart type
ChartTypeSwitcher redraws the same window of bars as candles, bars, a line, an area, Heikin-Ashi, Renko, or Point & Figure. Changing the type means a different renderer, so the series is created anew and its previous instance becomes invalid:
import {
  ChartType,
  ChartTypeSwitcher,
  allChartTypes,
  defaultChartTypePalette,
  parseChartType,
} from '@stocksharp/chart/ui';

const switcher = new ChartTypeSwitcher({
  chart,
  series,
  initialType: ChartType.Candle,
  availableTypes: allChartTypes,
  palette: defaultChartTypePalette,
  host: standaloneHost,
});
switcher.setRawCandles(candles);

switcher.onSeriesChanged(next => ui.menu.setPriceSource(next));

ui.legend.onChartTypeChange = value => {
  const type = parseChartType(value);
  if (type === null) return;

  switcher.switchType(type);
  ui.setCandles(switcher.getIndicatorCandles());
};
parseChartType reads the type from a string the page stored itself — a saved layout or a button attribute — and returns null when there is no such type. getIndicatorCandles gives out the bars the indicators are computed on after the switch: Renko and Point & Figure rebuild the source bars into their own, and isDerivedChartType(type) answers whether that happened — such bars carry no volume either. The other methods: getCurrentSeries, getCurrentType, getAvailableTypes, updatePrice.
Context menu
ChartContextMenu adds no rows of its own — the page supplies them through provideItems, returning groups of rows; a separator is drawn between the groups, and empty groups cost nothing. A row is described by a key, a label text, the optional icon, tone, and disabled, and the invoke method. The tone is set by the ChartContextMenuTone values: Neutral, Positive, Negative.
import { ChartContextMenuTone, createChartUi, standaloneHost } from '@stocksharp/chart/ui';

const ui = createChartUi(chart, {
  container,
  host: standaloneHost,
  priceSource: series,
  chartTypes: [],
  provideItems: context => [[
    {
      key: 'buy',
      label: `Buy at ${context.priceText}`,
      icon: 'bi bi-arrow-up-circle',
      tone: ChartContextMenuTone.Positive,
      invoke: () => placeOrder('buy', context.price),
    },
  ]],
});
To these rows createChartUi adds a group of its own — Add indicator… and Add pane…, both through host.translate. ChartContextMenuMode tells the menu on the price chart (Chart, there is a price under the cursor) from the one on a sub-pane header (Pane, there is no price). The methods: init, setPriceSource, openAt, close, dispose.
Other exports
ChartLegendandfullscreenMenuLayer— the legend and the layer its floating menu opens into (the fullscreen element when there is one, otherwisebody). The legend methods:init,setRawCandles,setChartType,setIndicatorEngine,refresh,dispose; theonEditIndicatorandonChartTypeChangecallbacks.ChartPaneManager— a wrapper over the engine's built-in panes:init,addPane,removePane,restorePane,getChart,getPanes,getPaneByMeasure,setPaneTitle,getValuesElement,legendLayer,resize,dispose.IndicatorDialogandcreateIndicatorCatalogController— the indicator dialog and the model of its catalog. The dialog methods:show,showForPane,showEdit,hide,dispose.IndicatorEngine,IndicatorRenderer,IndicatorSettings— the indicator machinery the dialog drives. Published both from here and from@stocksharp/chart/indicators.- The
LegendBar,LegendChartType,LegendChart,LegendPaneHost,LegendIndicatorEngine,IndicatorPaneChart,IndicatorPaneHost,ChartContextMenuProvider,PriceCoordinateSource,ChartTypePalette,ModalControllertypes — structural contracts: a page that lays out the panes or computes the indicators itself implements them with its own objects.