
Optimization results
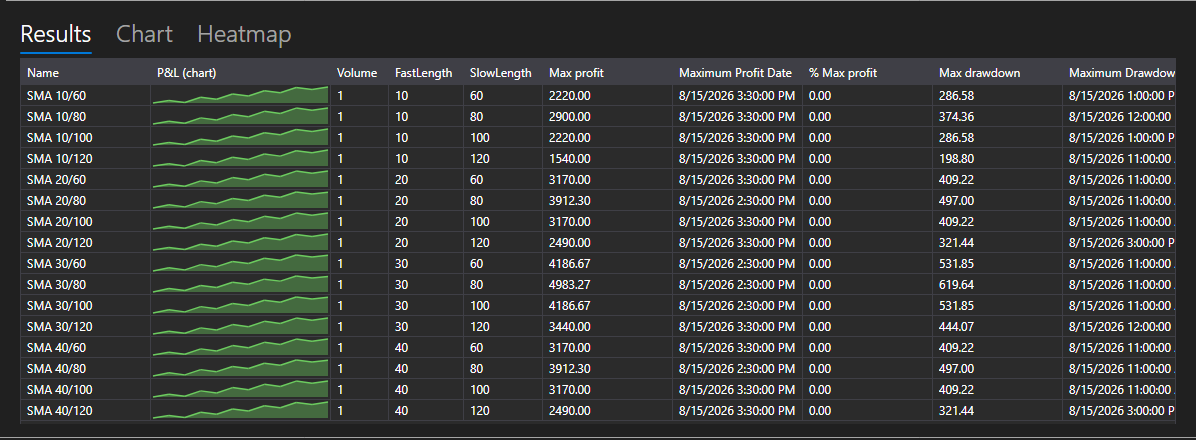
OptimizationResultsPanel - three ways to read the results of a sweep, collected in one control:
- Results - a table of runs: the parameter values, the statistics and the P&L chart of every run next to its numbers. This is StrategiesStatisticsPanel, so the columns are sorted and configured the same way as everywhere else.
- Chart - a three-dimensional surface over two parameters: the axes are chosen in the lists above the chart, the height - the selected statistics parameter.
- Heatmap - the same surface from above. The axes are set once, on the chart, and the map repeats them.
Main properties
- OptimizationResultsPanel.ViewModel - the results from which all three surfaces are drawn.
Runs are added to OptimizationResultsViewModel at the moment they start, not when they finish: the row appears in the table at once and then follows its strategy, so a running run is visible on all three surfaces.
- OptimizationResultsViewModel.AddRun - adds a run. The first run defines the columns of the table and what the axes offer.
- OptimizationResultsViewModel.Refresh - redraws the surfaces when the measured values have changed.
- OptimizationResultsViewModel.Clear - resets the runs before a new sweep.
One combination of parameters - one point of the surface. If a combination was run several times, the point shows the average; if a combination was not run at all, the heatmap fills it with the lowest value, so that a gap does not look like a peak.
Below are code snippets showing its usage:
<Window x:Class="Sample.OptimizationResultsWindow"
	xmlns="http://schemas.microsoft.com/winfx/2006/xaml/presentation"
	xmlns:x="http://schemas.microsoft.com/winfx/2006/xaml"
	xmlns:charting="http://schemas.stocksharp.com/xaml"
	Height="600" Width="900">
	<charting:OptimizationResultsPanel x:Name="ResultsPanel" />
</Window>
_results = new OptimizationResultsViewModel();
ResultsPanel.ViewModel = _results;

// The optimizer reports a run at the moment it starts
_optimizer.StrategyInitialized += (strategy, parameters) =>
	this.GuiAsync(() => _results.AddRun(strategy, parameters));