Charts
S# provides convenient components for charting. These components are gathered in the namespace StockSharp.Xaml.Charting.
The key concept in the graphics library is the notion of a chart. A chart is a container for other elements that are used in constructing charts. There are several types of charts in S#:
- Chart - A graphical component for displaying stock charts.
- ChartPanel - An advanced graphical component for displaying stock charts.
- EquityCurveChart - A graphical component for displaying equity curves.
- BoxChart - A chart representing volumes as a grid of numbers.
- ClusterChart - A chart displaying volumes as clusters with histograms.
- OptionPositionChart - A graphical component showing option positions and "Greeks" relative to the underlying asset. See OptionPositionChart.
Additionally, S# includes two types of charts for volume analysis: BoxChart and ClusterChart.
The following figure shows the main elements of the graphical component.
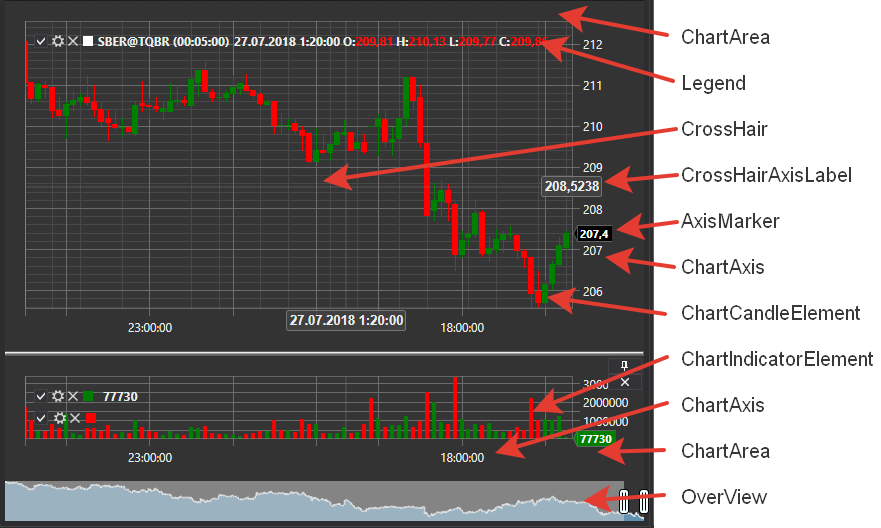
Graphical Component Elements
IChart
IChart is the basic interface for all types of charts. It includes methods for adding and removing "child" elements, properties to customize the appearance and drawing methods of the component, as well as a method to draw the charts themselves. A chart can contain several areas (IChartArea) for plotting (see figure). Chart also includes an OverView preview area (see figure). In this area, you can select the chart viewing zone using sliders. Additionally, you can scroll and zoom the chart using the dragging of the IChartArea, the X-axis, and the mouse wheel.
Key Properties and Methods of IChart
- IChart.Areas - List of IChartArea areas.
- IThemeableChart.ChartTheme - Theme of the component.
- IChart.IndicatorTypes - List of indicators that can be displayed on the chart.
- IChart.CrossHair - Enable/disable the display of crosshairs.
- IChart.CrossHairAxisLabels - Enable/disable the display of axis labels at crosshairs.
- IChart.IsAutoRange - Enable/disable automatic X-axis scaling.
- IChart.IsAutoScroll - Enable/disable auto-scrolling on the X-axis.
- IChart.ShowLegend - Enable/disable the display of the legend.
- IChart.ShowOverview - Enable/disable the display of the OverView preview area.
- IChart.AddArea - Add an IChartArea.
- [IChart.AddElement](xref:StockSharp.Charting.IChart.AddElement(StockSharp.Charting.IChartArea, StockSharp.Charting.IChartElement)) - Add a data series element. Has several overloads.
- IChart.Reset - "Reset" previously drawn values.
- IChart.Draw - Draw a value on the chart.
- IChart.OrderCreationMode - Order creation mode, when set allows creating orders from the chart. Default is off.
IChartArea
IChartArea - A chart plotting area, acts as a container for IChartElement (indicators, candles, etc.) that are rendered on the chart, and chart axes (IChartAxis).
Key Properties of IChartArea
- IChartArea.Elements - List of IChartElement.
- IChartArea.XAxises - List of horizontal axes.
- IChartArea.YAxises - List of vertical axes.
IChartElement
All elements displayed on the chart must implement the IChartElement interface. In S#, the following classes implement this interface:
- ChartCandleElement - An element for displaying candles.
- ChartIndicatorElement - An element for displaying indicators.
- ChartOrderElement - An element for displaying orders.
- ChartTradeElement - An element for displaying trades.
The classes of visual elements have several properties for adjusting the appearance of the chart. You can adjust colors, line thickness, and style of elements. For example, using the property IChartCandleElement.DrawStyle, you can change the appearance of the candle (candle or bar). Using the property ChartIndicatorElement.DrawStyle, you can set the style of the indicator line. To display the indicator as a histogram, use the value DrawStyles.Histogram. The properties ChartCandleElement.ShowAxisMarker and ChartIndicatorElement.ShowAxisMarker allow turning on/off the display of markers (see figure) on the axes of the chart.