Equity curve chart
EquityCurveChart - the graphical component for displaying the equity curve.
Below is an example of using this component. The full example code is in the Samples/Testing/SampleHistoryTesting.
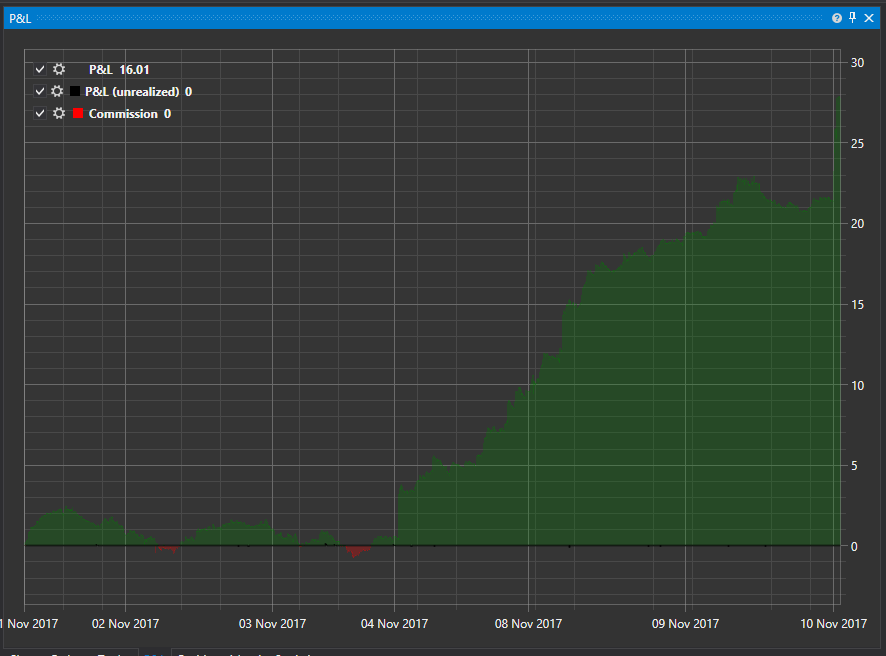
Example of the EquityCurveChart plotting
We add the EquityCurveChart graphical component to XAML. Assigning the Curve name to the component.
<Window x:Class="SampleRandomEmulation.MainWindow"
        xmlns="http://schemas.microsoft.com/winfx/2006/xaml/presentation"
        xmlns:x="http://schemas.microsoft.com/winfx/2006/xaml"
        xmlns:loc="clr-namespace:StockSharp.Localization;assembly=StockSharp.Localization"
        Title="{x:Static loc:LocalizedStrings.XamlStr564}" Height="460" Width="604"
 	xmlns:sx="clr-namespace:StockSharp.Xaml;assembly=StockSharp.Xaml"
 	xmlns:charting="http://schemas.stocksharp.com/xaml">

 <Grid>
 	<Grid.ColumnDefinitions>
 		<ColumnDefinition Width="85*" />
 		<ColumnDefinition Width="497*" />
 	</Grid.ColumnDefinitions>
 	<Grid.RowDefinitions>
 		<RowDefinition Height="Auto"/>
 		<RowDefinition Height="*"/>
 	</Grid.RowDefinitions>
 	<Grid Grid.ColumnSpan="2">
 		<Grid.ColumnDefinitions>
 			<ColumnDefinition Width="100" />
 			<ColumnDefinition Width="*" />
 			<ColumnDefinition Width="Auto" />
 		</Grid.ColumnDefinitions>
 		<Grid.RowDefinitions>
 			<RowDefinition Height="Auto" />
 			<RowDefinition Height="10" />
 			<RowDefinition Height="Auto" />
 			<RowDefinition Height="10" />
 		</Grid.RowDefinitions>
 		<Button x:Name="StartBtn" Content="{x:Static loc:LocalizedStrings.Str2421}" Grid.Row="0" Click="StartBtnClick" />
 		<ProgressBar x:Name="TestingProcess" Grid.Column="1" Grid.Row="0" />
 		<Button x:Name="Report" Content="{x:Static loc:LocalizedStrings.XamlStr432}" Grid.Row="0" Width="75" IsEnabled="False" Click="ReportClick" Grid.Column="2" Margin="0,0,0,-1" />
 	</Grid>

 	<Grid Grid.Row="1" Grid.ColumnSpan="2" Grid.Column="0">
 		<Grid>
 			<Grid.ColumnDefinitions>
 				<ColumnDefinition Width="180"/>
 				<ColumnDefinition Width="*"/>
 			</Grid.ColumnDefinitions>
 			<sx:StatisticParameterGrid Grid.Column="0" x:Name="ParameterGrid" />
 			<charting:EquityCurveChart Grid.Column="1" x:Name="EquityCurveChart" />
 		</Grid>
 	</Grid>
 </Grid>
</Window>
In the main window code we create a data source to draw the chart using the EquityCurveChart.CreateCurve(System.String title, System.Windows.Media.Color color, System.Windows.Media.Color secondColor, Ecng.Drawing.DrawStyles style, System.Guid id ) method.
private ChartBandElement _pnl;
private ChartBandElement _unrealizedPnL;
private ChartBandElement _commissionCurve;

.................................................

public MainWindow()
{
 InitializeComponent();

 _logManager.Listeners.Add(new FileLogListener("log.txt"));

 _pnl = (ChartBandElement)EquityCurveChart.CreateCurve("PNL", Colors.Green, DrawStyles.Area);
 _unrealizedPnL = (ChartBandElement)EquityCurveChart.CreateCurve("unrealizedPnL", Colors.Black, DrawStyles.Line);
 _commissionCurve = (ChartBandElement)EquityCurveChart.CreateCurve("commissionCurve", Colors.Red, DrawStyles.Line);
}
When the PnL value of the strategy is changed we add data to the data source. In this case we use the special ChartDrawData class.
_strategy.PnLChanged += () =>
{
 var data = new ChartDrawData();
 data.Group(_strategy.CurrentTime)
 	.Add(_pnl, _strategy.PnL)
 	.Add(_unrealizedPnL, _strategy.PnLManager.UnrealizedPnL ?? 0)
 	.Add(_commissionCurve, _strategy.Commission ?? 0);

 EquityCurveChart.Draw(data);
};