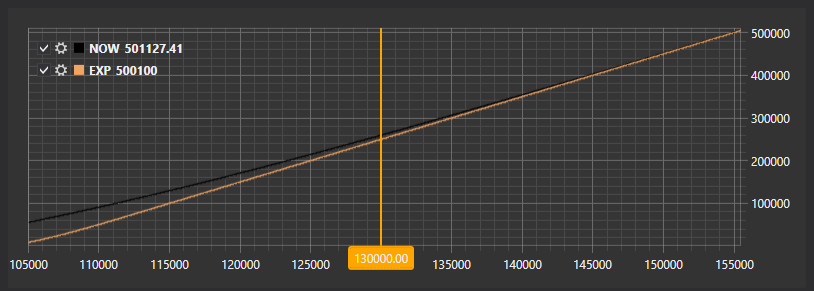
Position chart
The OptionPositionChart graphical component is a chart showing the position and the options “Greeks” related to the underlying asset.
The following is the SampleOptionQuoting example, in which this chart is used. The source code of the example can be found in the Samples/06_Strategies/09_LiveOptionsQuoting folder.
SampleOptionQuoting example
In the XAML code, add the OptionPositionChart element and assign it the PosChart name.
<Window x:Class="OptionCalculator.MainWindow"
        xmlns="http://schemas.microsoft.com/winfx/2006/xaml/presentation"
        xmlns:x="http://schemas.microsoft.com/winfx/2006/xaml"
        xmlns:loc="clr-namespace:StockSharp.Localization;assembly=StockSharp.Localization"
        xmlns:xaml="http://schemas.stocksharp.com/xaml"
        Title="{x:Static loc:LocalizedStrings.XamlStr396}" Height="400" Width="1030">
    <Grid Margin="5,5,5,5">

     .........................................................

     <xaml:OptionPositionChart x:Name="PosChart" Grid.Row="7" Grid.Column="0" Grid.ColumnSpan="6" />
 </Grid>
</Window>
In the C# code, create a connection and subscribe to the necessary events.
...
public readonly Connector Connector = new Connector();
...
// subscribe on connection successfully event
Connector.Connected += () =>
{
 // update gui labels
 this.GuiAsync(() => ChangeConnectStatus(true));
};
// subscribe on disconnection event
Connector.Disconnected += () =>
{
 // update gui labels
 this.GuiAsync(() => ChangeConnectStatus(false));
};
// subscribe on connection error event
Connector.ConnectionError += error => this.GuiAsync(() =>
{
 // update gui labels
 ChangeConnectStatus(false);
 MessageBox.Show(this, error.ToString(), LocalizedStrings.ErrorConnection);
});
// fill underlying asset's list
Connector.SecurityReceived += (sub, security) =>
{
 if (security.Type == SecurityTypes.Future)
 	_assets.Add(security);
};
Connector.Level1Received += (sub, security) =>
{
 if (_model.UnderlyingAsset == security || _model.UnderlyingAsset.Id == security.UnderlyingSecurityId)
 	_isDirty = true;
};
// subscribing on tick prices and updating asset price
Connector.TickTradeReceived += (sub, trade) =>
{
 if (_model.UnderlyingAsset == trade.Security || _model.UnderlyingAsset.Id == trade.Security.UnderlyingSecurityId)
 	_isDirty = true;
};
Connector.NewPosition += position => this.GuiAsync(() =>
{
 var asset = SelectedAsset;
 if (asset == null)
 	return;
 var assetPos = position.Security == asset;
 var newPos = position.Security.UnderlyingSecurityId == asset.Id;
 if (!assetPos && !newPos)
 	return;
 RefreshChart();
});
Connector.PositionChanged += position => this.GuiAsync(() =>
{
 if ((PosChart.AssetPosition != null && PosChart.AssetPosition == position) || PosChart.Positions.Cache.Contains(position))
 	RefreshChart();
});
try
{
 if (File.Exists(_settingsFile))
 	Connector.Load(new JsonSerializer<SettingsStorage>().Deserialize(_settingsFile));
}
...
When connecting, set the initial control settings:
- Resetting the model of the OptionPositionChart.Model control;
- Redrawing the chart with the initial values OptionPositionChart.Refresh(System.Nullable<System.Decimal> assetPrice, System.Nullable<System.DateTimeOffset> currentTime, System.Nullable<System.DateTimeOffset> expiryDate );
- Specifying message provider for market data and instruments.
private void ConnectClick(object sender, RoutedEventArgs e)
{
 if (!_isConnected)
 {
 	ConnectBtn.IsEnabled = false;
...
 	PosChart.Model = null;
...
 	PosChart.MarketDataProvider = Connector;
 	PosChart.SecurityProvider = Connector;
 	PosChart.PositionProvider = Connector;
 	Connector.Connect();
 }
 else
 	Connector.Disconnect();
}
When receiving instruments, we add the underlying assets to the list.
Connector.SecurityReceived += (sub, security) =>
{
 if (security.Type == SecurityTypes.Future)
 	_assets.Add(security);
};
Upon changing the Level1 of the underlying instrument or options, as well as getting a new trade we set the _isDirty flag. This allows to call the RefreshChart method (see below) in the timer event (the code is omitted) to redraw the chart. Thus we control the frequency of redrawing.
Connector.Level1Received += (sub, security) =>
{
 if (_model.UnderlyingAsset == security || _model.UnderlyingAsset.Id == security.UnderlyingSecurityId)
 	_isDirty = true;
};
Connector.TickTradeReceived += (sub, trade) =>
{
 if (_model.UnderlyingAsset == trade.Security || _model.UnderlyingAsset.Id == trade.Security.UnderlyingSecurityId)
 	_isDirty = true;
};
In the new position occurrence event handler, we call
RefreshChartto redraw the chart.Connector.NewPosition += position => this.GuiAsync(() => { var asset = SelectedAsset; if (asset == null) return; var assetPos = position.Security == asset; var newPos = position.Security.UnderlyingSecurityId == asset.Id; if (!assetPos && !newPos) return; RefreshChart(); }); Connector.PositionChanged += position => this.GuiAsync(() => { if ((PosChart.AssetPosition != null && PosChart.AssetPosition == position) || PosChart.Positions.Cache.Contains(position)) RefreshChart(); });This method redraws the chart:
private void RefreshChart()
{
 var asset = SelectedAsset;
 var trade = asset.LastTrade;
 if (trade != null)
 	PosChart.Refresh(trade.Price);
}