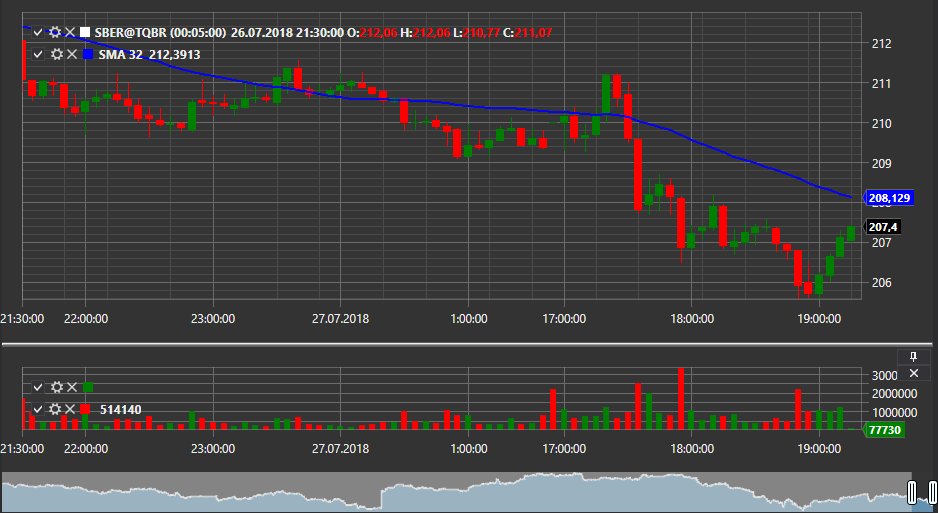
Candle Chart
Chart is a graphical component that allows building stock charts: candles, indicators, and displaying order and trade markers on charts.
Below is an example of building a chart using the Chart component. The example is based on Samples/Common/SampleConnection, with some modifications.

Example of building a chart using Chart
In XAML, we create a window and add the Chart graphical component to it. We assign the name Chart to the component. Note that when creating the window, you need to add the namespace http://schemas.stocksharp.com/xaml.
<Window x:Class="SampleCandles.ChartWindow"
        xmlns="http://schemas.microsoft.com/winfx/2006/xaml/presentation"
        xmlns:x="http://schemas.microsoft.com/winfx/2006/xaml"
        xmlns:charting="http://schemas.stocksharp.com/xaml"
        Title="ChartWindow" Height="300" Width="300">
   <charting:Chart x:Name="Chart" x:FieldModifier="public" />
</Window>
In the main window code, we declare variables for chart areas, chart elements, indicators, and subscriptions.
private readonly Dictionary<Subscription, ChartWindow> _chartWindows = new Dictionary<Subscription, ChartWindow>();
private readonly Connector _connector = new Connector();
private readonly LogManager _logManager;
private ChartArea _candlesArea;
private ChartArea _indicatorsArea;
private ChartIndicatorElement _smaChartElement;
private ChartIndicatorElement _macdChartElement;
private ChartCandleElement _candlesElem;
private SimpleMovingAverage _sma;
private MovingAverageConvergenceDivergence _macd;
In the Connect button's Click event handler, along with subscribing to connector events and calling the IConnector.Connect method, we subscribe to the Connector.CandleReceived event. In this event handler, the chart will be drawn when a new candle is received.
private void ConnectClick(object sender, RoutedEventArgs e)
{
    _connector.CandleReceived += OnCandleReceived;

    // Subscribe to other necessary events
    _connector.Connected += () => this.GuiAsync(() => { /* Handle connection */ });
    _connector.Disconnected += () => this.GuiAsync(() => { /* Handle disconnection */ });

    // Connect to the trading system
    _connector.Connect();
}
In the ShowChart button handler, we create indicator objects, areas, and chart elements. We add elements to areas, and areas to the chart. We open the chart window and start a subscription to candles.
private void ShowChartClick(object sender, RoutedEventArgs e)
{
    var security = SelectedSecurity;

    // Create a subscription to candles
    var subscription = new Subscription(
        DataType.TimeFrame(TimeSpan.FromMinutes(5)),
        security)
    {
        MarketData =
        {
            // Request historical data for 30 days
            From = DateTime.Today.Subtract(TimeSpan.FromDays(30)),
            To = DateTime.Now,
            // Get only finished candles
            IsFinishedOnly = true
        }
    };

    // Create a chart window
    _chartWindows.SafeAdd(subscription, key =>
    {
        var wnd = new ChartWindow
        {
            Title = $"{security.Code} {TimeSpan.FromMinutes(5)}"
        };
        wnd.MakeHideable();

        // Initialize indicators
        _sma = new SimpleMovingAverage() { Length = 11 };
        _macd = new MovingAverageConvergenceDivergence();

        // Initialize chart elements
        _smaChartElement = new ChartIndicatorElement();
        _macdChartElement = new ChartIndicatorElement();
        _candlesElem = new ChartCandleElement();

        // Set MACD display style as histogram
        _macdChartElement.DrawStyle = DrawStyles.Histogram;

        // Initialize chart areas
        _candlesArea = new ChartArea();
        _indicatorsArea = new ChartArea();

        // Add areas to the chart
        wnd.Chart.Areas.Add(_candlesArea);
        wnd.Chart.Areas.Add(_indicatorsArea);

        // Add elements to areas
        _candlesArea.Elements.Add(_candlesElem);
        _candlesArea.Elements.Add(_smaChartElement);
        _indicatorsArea.Elements.Add(_macdChartElement);

        // Bind chart elements to subscription for automatic drawing
        wnd.Chart.AddElement(_candlesArea, _candlesElem, subscription);
        wnd.Chart.AddElement(_candlesArea, _smaChartElement, subscription);
        wnd.Chart.AddElement(_indicatorsArea, _macdChartElement, subscription);

        return wnd;
    }).Show();

    // Start subscription to candles
    _connector.Subscribe(subscription);
}
In the Connector.CandleReceived event handler, we draw the candle and indicator values for each finished candle.
private void OnCandleReceived(Subscription subscription, ICandleMessage candle)
{
    var wnd = _chartWindows.TryGetValue(subscription);
    if (wnd == null)
        return;

    // Process only finished candles
    if (candle.State != CandleStates.Finished)
        return;

    // Calculate indicator values
    var smaValue = _sma.Process(candle);
    var macdValue = _macd.Process(candle);

    // Create data for drawing
    var data = new ChartDrawData();
    data
        .Group(candle.OpenTime)
            .Add(_candlesElem, candle)
            .Add(_smaChartElement, smaValue)
            .Add(_macdChartElement, macdValue);

    // Draw data on the chart in the user interface thread
    this.GuiAsync(() => wnd.Chart.Draw(data));
}
Example with automatic chart drawing
Starting with the latest versions of StockSharp, it is possible to set up automatic chart drawing without the need to explicitly call the Draw method. For this, when configuring Chart, the AddElement method is used, which links the chart element with a subscription:
private void SetupAutoDrawingChart()
{
	var security = SelectedSecurity;

	// Create chart elements
	var candleElement = new ChartCandleElement();
	var smaElement = new ChartIndicatorElement { Title = "SMA" };

	// Create chart areas
	var area = new ChartArea();

	// Add area to the chart
	Chart.Areas.Add(area);

	// Create a subscription to candles
	var subscription = new Subscription(
		DataType.TimeFrame(TimeSpan.FromMinutes(5)),
		security)
	{
		MarketData =
		{
			From = DateTime.Today.Subtract(TimeSpan.FromDays(30)),
			To = DateTime.Now
		}
	};

	// Bind elements to the chart area and subscription
	Chart.AddElement(area, candleElement, subscription);
	Chart.AddElement(area, smaElement, subscription);

	// Create an indicator
	var sma = new SimpleMovingAverage { Length = 14 };

	// Subscribe to the candle receiving event for indicator processing
	_connector.CandleReceived += (sub, candle) =>
	{
		if (sub == subscription && candle.State == CandleStates.Finished)
		{
			// Process the candle with the indicator and get the value
			var smaValue = sma.Process(candle);

			// Draw the indicator value
			var data = new ChartDrawData();
			data
				.Group(candle.OpenTime)
					.Add(smaElement, smaValue);

			this.GuiAsync(() => Chart.Draw(data));
		}
	};

	// Start subscription
	_connector.Subscribe(subscription);
}
Displaying orders and trades on the chart
You can display order and trade markers directly on the chart:
// Create elements for displaying orders and trades
var orderElement = new ChartOrderElement();
var tradeElement = new ChartTradeElement();

// Add elements to the chart area
_candlesArea.Elements.Add(orderElement);
_candlesArea.Elements.Add(tradeElement);

// Subscribe to order and trade receiving events
_connector.OrderReceived += (sub, order) =>
{
	if (order.Security != _security)
		return;

	// Draw the order on the chart
	var data = new ChartDrawData();
	data.Group(order.Time).Add(orderElement, order);

	this.GuiAsync(() => Chart.Draw(data));
};

_connector.OwnTradeReceived += (sub, trade) =>
{
	if (trade.Order.Security != _security)
		return;

	// Draw the trade on the chart
	var data = new ChartDrawData();
	data.Group(trade.Time).Add(tradeElement, trade);

	this.GuiAsync(() => Chart.Draw(data));
};
Clearing the chart
To clear the chart, you can use the Reset method:
// Clear the entire chart
Chart.Reset();

// Clear a specific area
_candlesArea.Reset();

// Clear a specific element
_candlesElem.Reset();