Candle Generation
Hydra allows you to generate various types of candles based on downloaded trades, which can subsequently be exported to Excel, XML, SQL, BIN, JSON, or TXT formats.
This allows you to use the generated data in any technical analysis programs (WealthLab, AmiBroker, etc.).
Candle Generation Process
On the General tab, click the Candles button, and the following window will open:
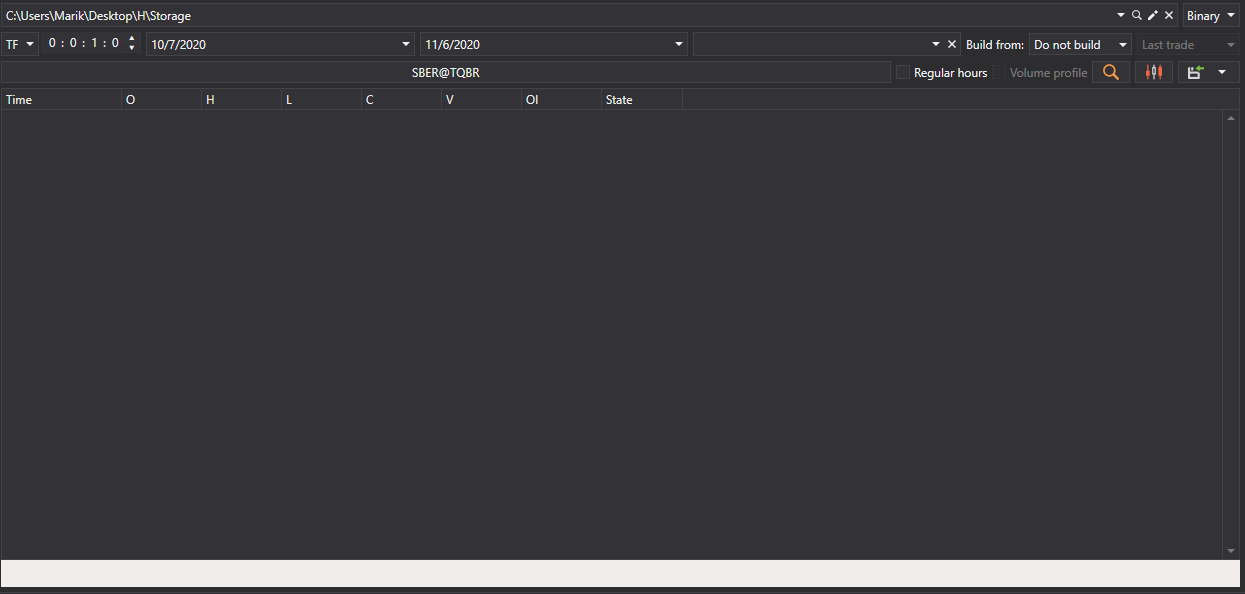
In the opened window, you need to configure the candle generation parameters:
- Select the desired candle type from the dropdown list (all standard candle types are supported)
- Specify the necessary parameters for the selected candle type:
- For TimeFrameCandleMessage - select Timeframe
- For VolumeCandleMessage - specify Volume
- For TickCandleMessage - specify Number of ticks
- For RangeCandleMessage - specify Range
- For RenkoCandleMessage - specify Block size
- For PnFCandleMessage - specify P&F Parameters
- Select the instrument for which candles will be generated
- Specify a time range (if necessary)
- Click the
 button to start generation
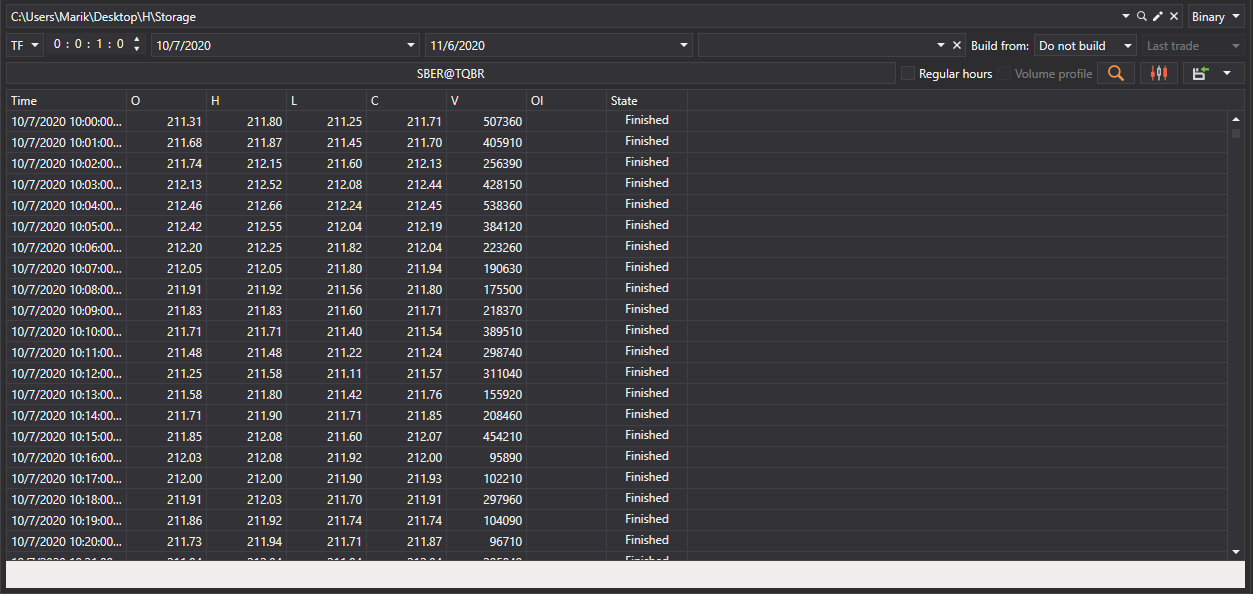
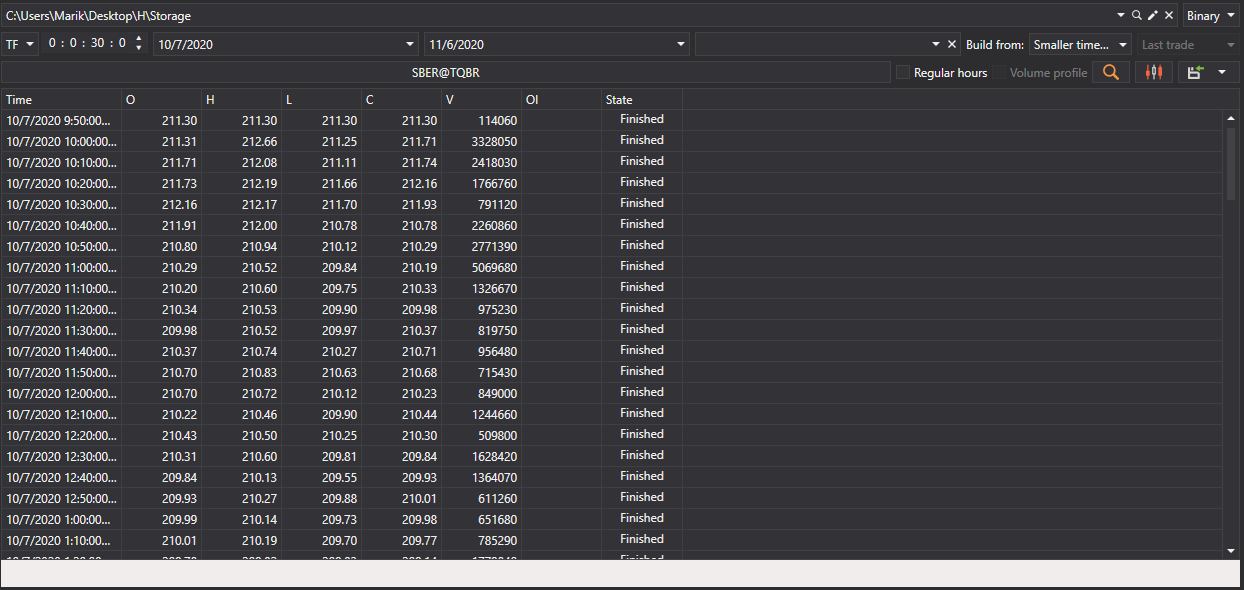
Example of Timeframe Candle Generation
To generate 5-minute candles for the SBER@TQBR instrument:
- Select the candle type TimeFrameCandleMessage
- Set Timeframe = 5 min
- Select the SBER@TQBR instrument
- Click the search button
After data generation, you will see the result:
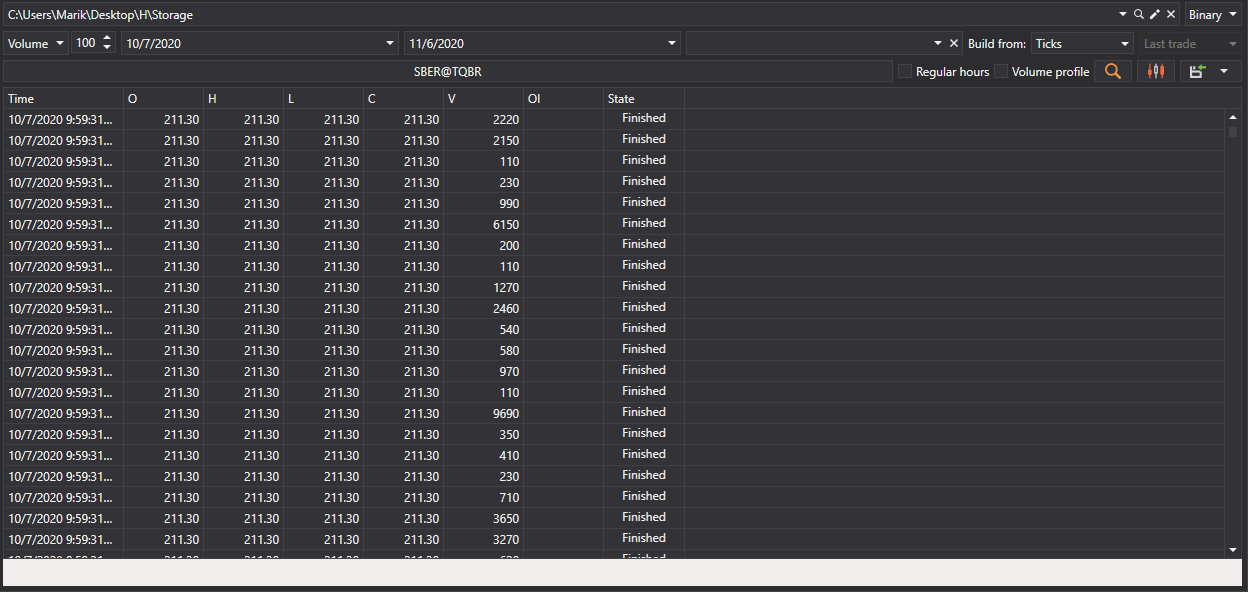
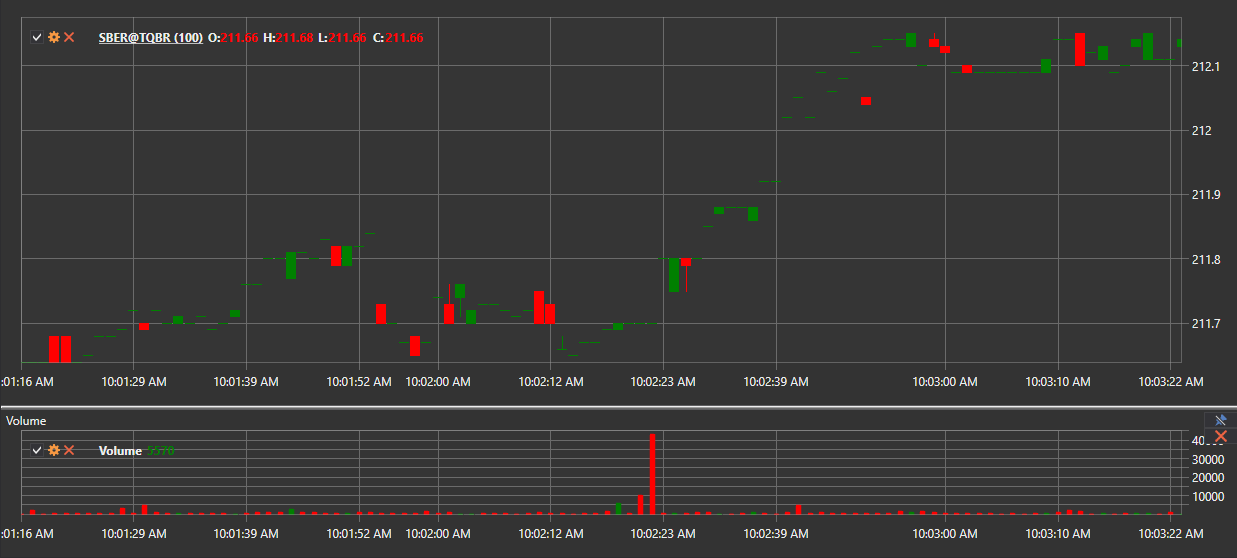
Example of Volume Candle Generation
To generate volume candles:
- Select the candle type VolumeCandleMessage
- Specify the volume (for example, 100)
- Select the instrument
- In the Build from field, select Ticks
- Click the search button
Generation result:
Data Sources for Building Candles
If market data could not be obtained directly from the source, you can generate candles by selecting in the Build from field the type of data from which they will be built:
- Ticks - building candles from tick data
- Order Books - building candles from order book data
- Level1 - building candles from Level1 data
- Smaller Timeframe - building candles with a larger timeframe from candles with a smaller one
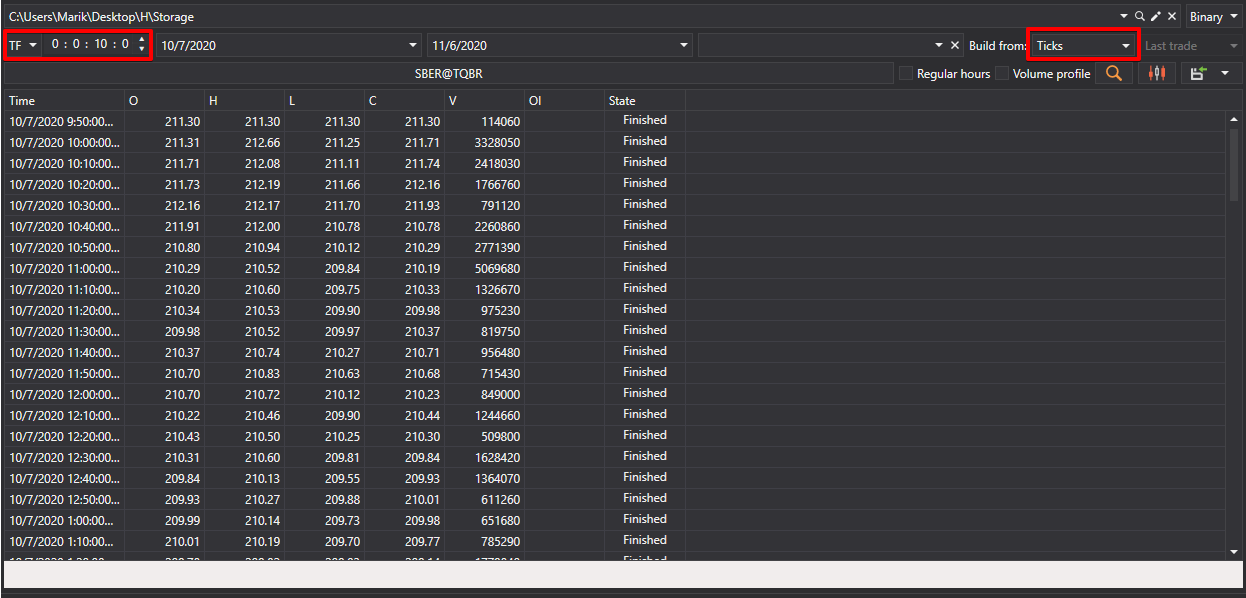
Examples of Different Building Options:
10-minute candles from ticks:
30-minute candles from 5-minute candles:
Tip
If you select don't build in the Build from field, only ready-made candles that were downloaded directly through the data source will be searched.
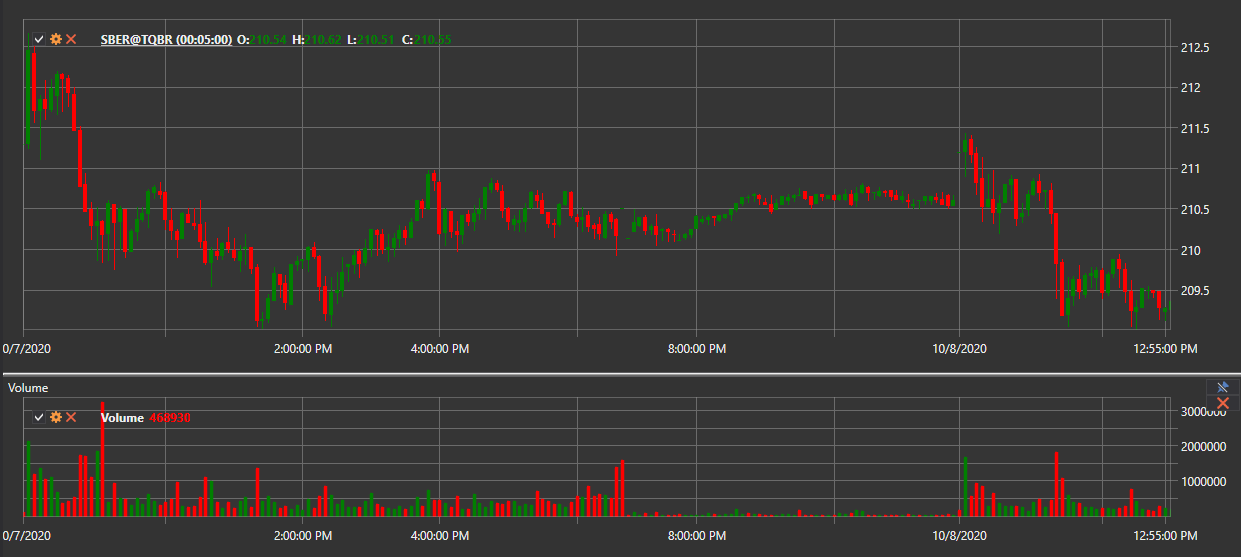
Visualization of Generated Candles
For graphical display of generated candles:
Click the
 button
A chart with the built candles will open:
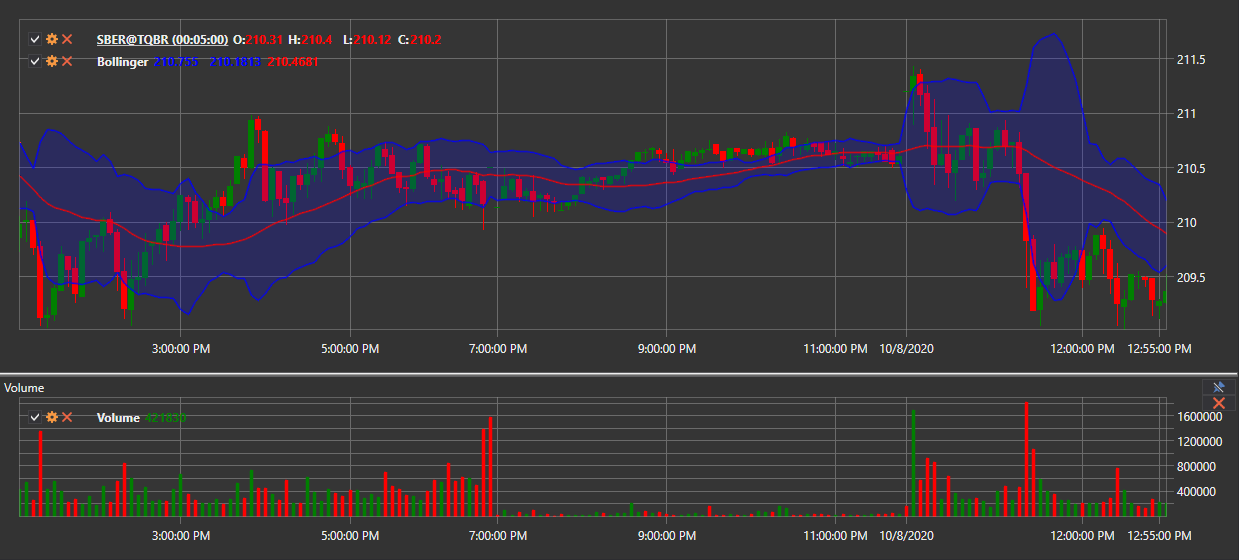
Adding Indicators to the Chart
Technical indicators can be added to the candle chart:
- Open the context menu by right-clicking on the chart panel
- Select the Indicator item and the desired indicator from the list
- To display the indicator on a separate panel:
- Add a new panel using the
 button
 - Select the desired indicator from the context menu
- Add a new panel using the
Example of a chart with added indicators:
Data Export
The obtained candle values can be exported to various formats for use in other programs.
Also see the video tutorial on building various types of candles