Debugging a DLL with Visual Studio
Visual Studio provides a mechanism for attaching to running processes using the Visual Studio debugger. The Visual Studio debugger is described in more detail in the documentation Attach to running processes. The debugging process will be demonstrated using the example of a strategy added in the section Using DLL.
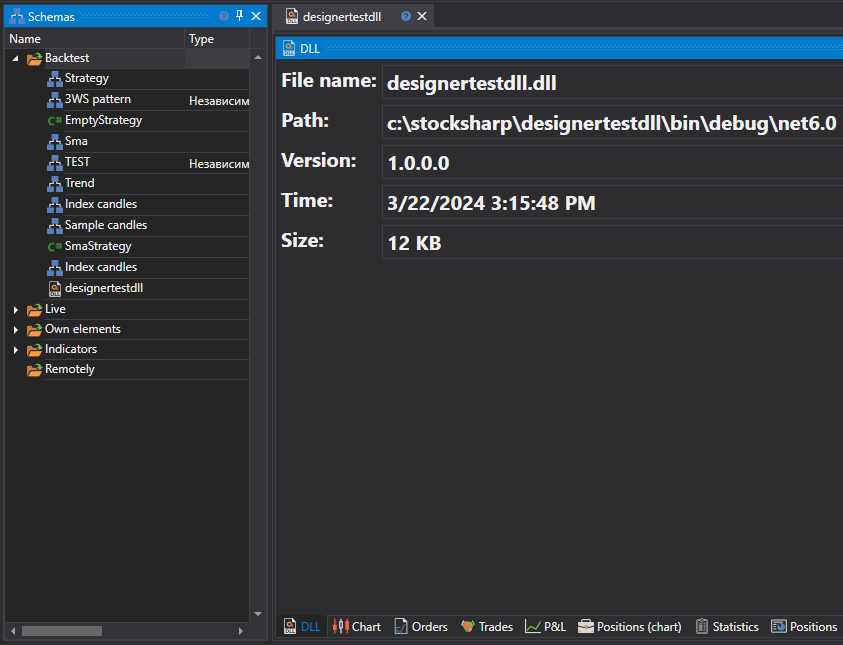
- To attach to a process and start debugging a DLL strategy, it needs to be loaded into memory. The DLL is loaded into memory after adding the strategy. Once the DLL is loaded into memory, you can attach to the process.
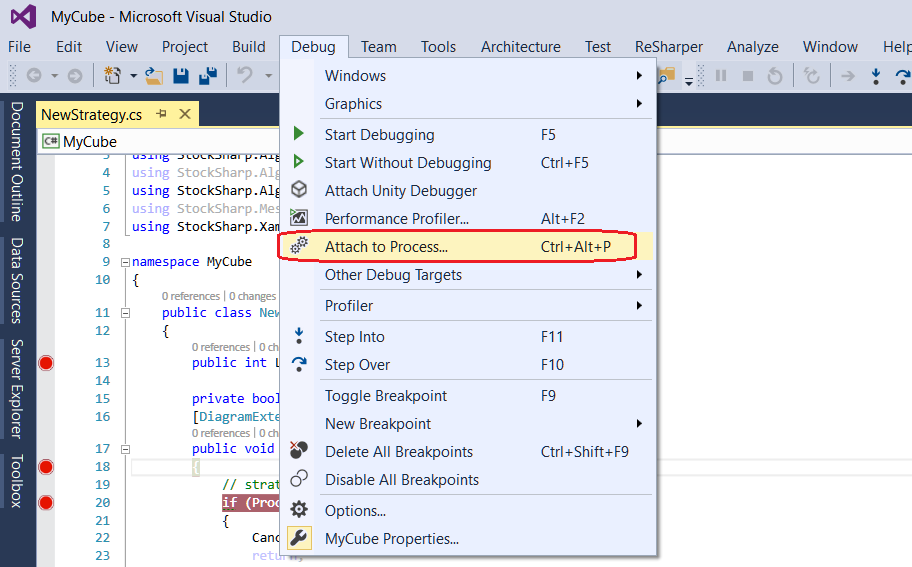
- In Visual Studio, select Debug -> Attach to Process.
- In the Attach to Process dialog box, find the Designer.exe process in the Available processes list that you want to attach to.
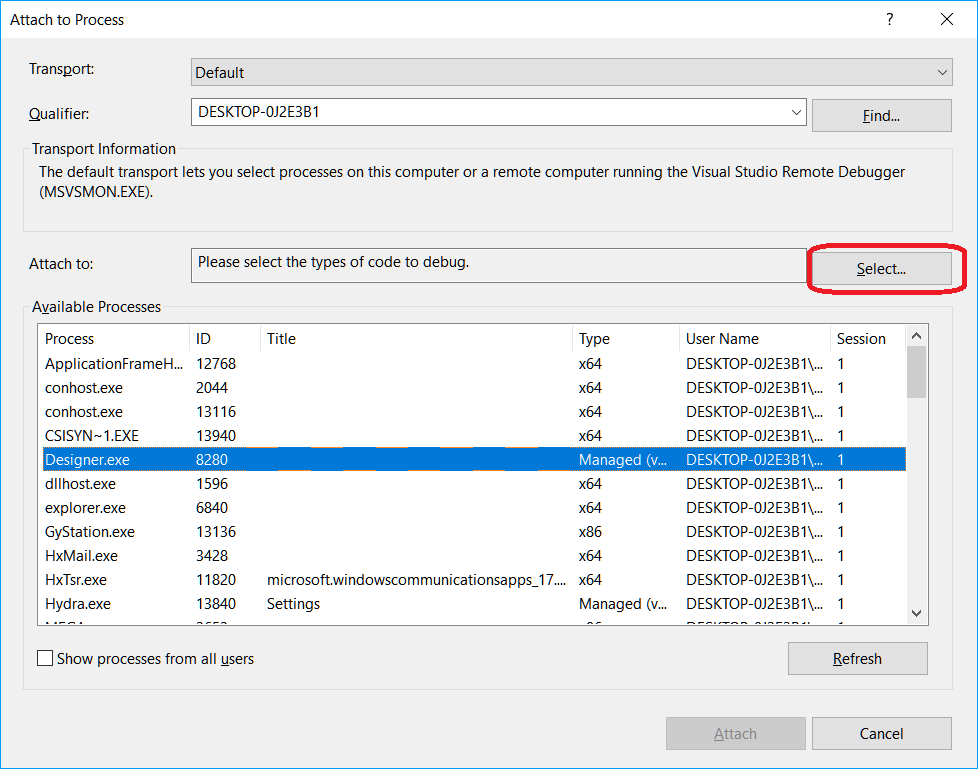
If the process is running under a different user account, you need to check the Show processes from all users checkbox.
- It's important that the Attach to window specifies the code type that needs to be debugged. The default Auto parameter tries to determine the code type to be debugged, but it does not always correctly identify the code type. To manually set the code type, you need to do the following steps.
- In the Attach to field, click Select.
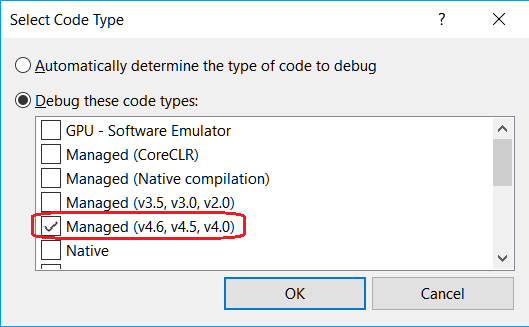
- In the Select Code Type dialog box, click the Debug these code types button and select the types for debugging.
- Click OK.
Click the Attach button.
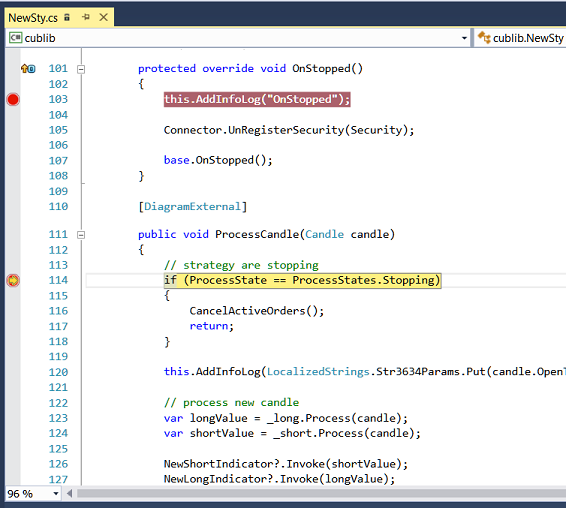
In Visual Studio, set breakpoints in the code. If the breakpoints are red and filled with red
 (and Studio is in debugging mode), it means that the exact version of the DLL was loaded. If the breakpoints are red and filled with white
  (and Studio is in debugging mode), it means that the wrong version of the DLL was loaded.
In the example, the breakpoint is set in the first line of the method public void ProcessCandle(Candle candle). When the strategy runs in Designer, as soon as candle values start being passed to the DLL, Visual Studio will stop at the breakpoint. From there, you can track the execution of the code:
Warning
When the code is stopped under the debugger, all processes inside the Designer program are suspended. If the program is connected to real trading, then in the case of a long stop under the debugger, disconnections will occur.