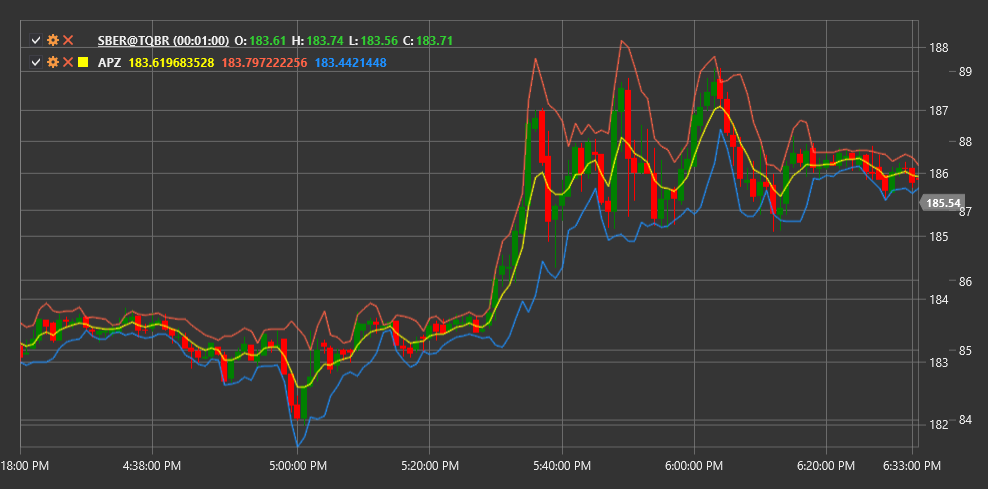
APZ
Adaptive Price Zone (APZ) is a technical indicator developed by Lee Leibfarth that creates dynamic support and resistance zones, adapting to market volatility.
To use the indicator, you need to use the AdaptivePriceZone class.
Description
The APZ indicator consists of two lines (upper and lower) that form a price zone around the average price. This zone expands and contracts depending on the current market volatility. When the market becomes more volatile, the zone expands; when volatility decreases, the zone narrows.
APZ is particularly useful for:
- Identifying potential support and resistance levels
- Detecting possible trend reversal points
- Revealing periods of increased and decreased volatility
- Creating trading systems based on price zone breakouts
Parameters
The indicator has the following parameters:
- Period - calculation period (default value: 5)
- BandPercentage - percentage of range to define band width (default value: 2%)
Calculation
The APZ calculation is based on the Exponential Moving Average (EMA) and Average True Range (ATR):
First, calculate the EMA of price for the specified period:
EMA = Exponential Moving Average of price over PeriodThen calculate volatility using ATR:
Volatility = Exponential Moving Average of ATR over PeriodThe upper and lower APZ lines are computed as follows:
Upper Line = EMA + (Volatility * BandPercentage)
Lower Line = EMA - (Volatility * BandPercentage)
When the price is above the upper APZ line, this can be considered an upward trend. When the price is below the lower APZ line, this may indicate a downward trend. When the price moves within the APZ zone, the market may be in a consolidation or sideways movement phase.
