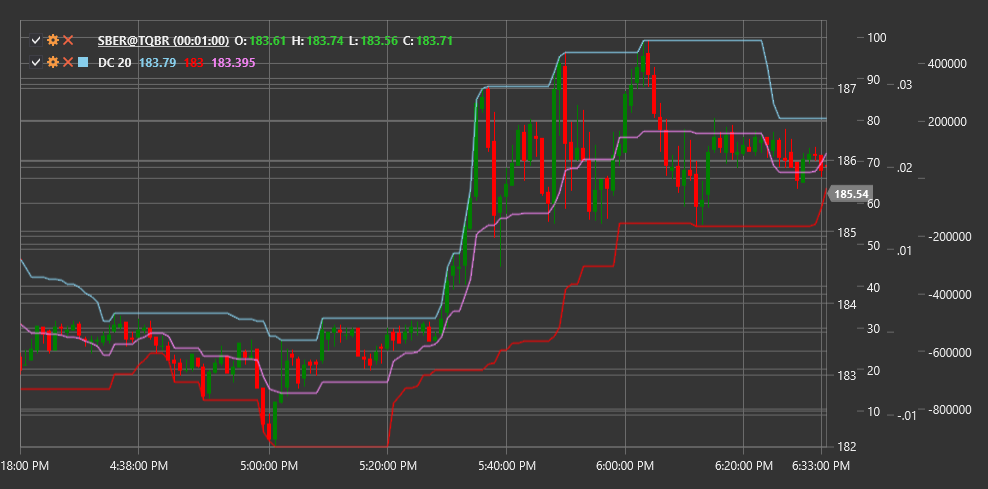
DC
Donchian Channels (DC) is a technical indicator developed by trader Richard Donchian, consisting of an upper and lower band (channel boundaries) based on the maximum and minimum price values over a specific period.
To use the indicator, you need to use the DonchianChannels class.
Description
Donchian Channels are a simple yet effective volatility and trend indicator. The indicator consists of three lines:
- Upper line: highest high over the selected period
- Lower line: lowest low over the selected period
- Middle line: average value between the upper and lower lines
This indicator was first used by Richard Donchian in his 4-week channel rule, according to which a buy signal occurs when the price exceeds the highest high of 4 weeks, and a sell signal occurs when the price falls below the lowest low of 4 weeks.
Donchian Channels are useful for:
- Identifying market volatility
- Determining support and resistance levels
- Generating breakout signals
- Defining the current trading range
Parameters
The indicator has the following parameters:
- Length - calculation period (default value: 20)
Calculation
Donchian Channels calculation is quite simple:
Upper channel line:
Upper = Highest High over Length periodLower channel line:
Lower = Lowest Low over Length periodMiddle channel line:
Middle = (Upper + Lower) / 2
Interpretation
Donchian Channels can be used in various ways:
Breakout Strategies:
- Breaking above the upper channel line can be viewed as a buy signal
- Breaking below the lower channel line can be viewed as a sell signal
Trend Determination:
- If the price is in the upper half of the channel (above the middle line), an upward trend can be inferred
- If the price is in the lower half of the channel (below the middle line), a downward trend can be inferred
Support and Resistance Levels:
- The upper channel line can serve as a resistance level
- The lower channel line can serve as a support level
Volatility Measurement:
- Channel width (difference between upper and lower lines) indicates market volatility
- Channel expansion indicates increased volatility
- Channel contraction indicates decreased volatility
Counter-Trend Strategies:
- Some traders use opposite signals, expecting the price to return to the middle line after reaching the channel edges
