Bollinger Bands
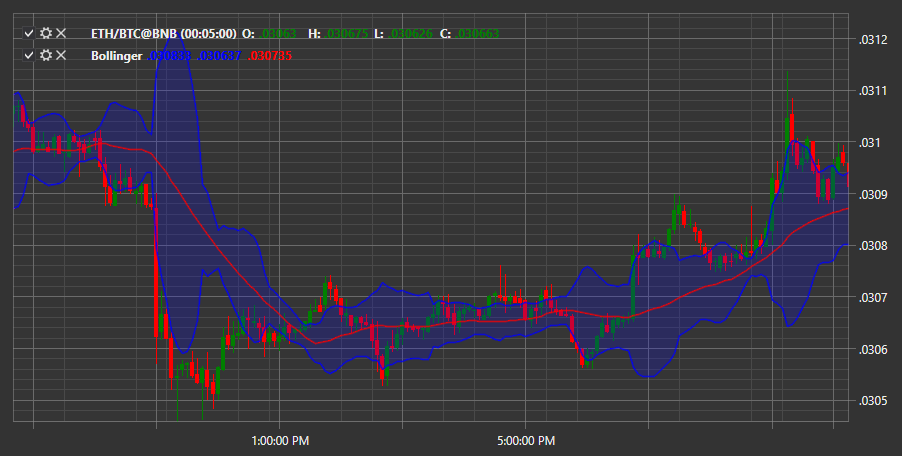
Bollinger Bands are an oscillating indicator used to measure market volatility. It allows assessing whether the price is high or low compared to the moving average. The central band corresponds to the simple moving average of the price. The upper and lower bands are levels at which the price can be considered high or low relative to the moving average.
To use the indicator, the BollingerBands class should be used.
Calculation
The following parameters with corresponding settings are used to calculate Bollinger Bands:
- type of standard deviation — usually double;
- period of Moving Average — at the trader's discretion.
Thus, the indicator is formed by three lines: central, upper, and lower, each with its formula:
Middle Line (ML) = Moving Average (SMA (Close, N))
Upper Band = ML + (D x Standard Deviation)
Lower Band = ML - (D x Standard Deviation), where
D - the channel width set in settings, Standard Deviation (StdDev) - standard deviation, calculated by the formula: SQRT(Sum(Close, n))^2, n)/n), where
Sum - the sum for n periods, n - calculation period, SQRT - square root, Close - closing price.