Components
During testing or trading, there arises a need to fully control the process. For complete control and analysis, Designer includes graphical components that can be added by selecting them in the Ribbon under the Components group:
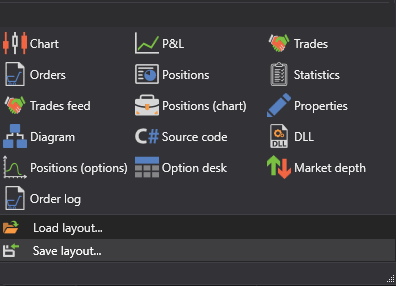
- Chart - represents a candlestick chart and/or indicators. Contains all the Chart Panel cubes present in the strategy.
- P/L - represents a chart of Profit/Loss (unrealized), Profit/Loss (realized), and commissions.
- Trades - represents a table with trades, displaying complete information about all the strategy's trades.
- Orders - represents a table with orders, displaying complete information about all the strategy's orders.
- Positions - represents a table of positions for the strategy's instruments.
- Statistics - represents a table, grouped by categories: P/L, Trades, Positions, Orders. It contains data about the strategy's performance.
- Trade Tape - represents a table with trades, displaying complete information about all the trades for selected instruments.
- Position Chart - represents a Position chart.
- Properties - represents a table of Testing Properties or a table of Live Trading Properties.
- Scheme - represents the schema designer.
- Source Code - represents a window for creating or editing strategies based on source code.
- DLL - a window for viewing DLL metadata. In case of creating a strategy based on a ready DLL.
- Options Position Chart - represents an options position chart.
- Options Board - represents an options table.
- Depth - represents a table of limit orders for buying and selling.
- Order Log - represents a table with orders, displaying complete information about all orders for selected instruments.