First strategy
To create schemas of strategies and composite elements, and to test the obtained strategies on historical data, you can use an example of the strategy of moving average (SMA). It allows you to go through a complete cycle from creating a strategy to its testing and debugging. The strategy of moving average (SMA) can be found in the Strategies folder of the Schemas panel.
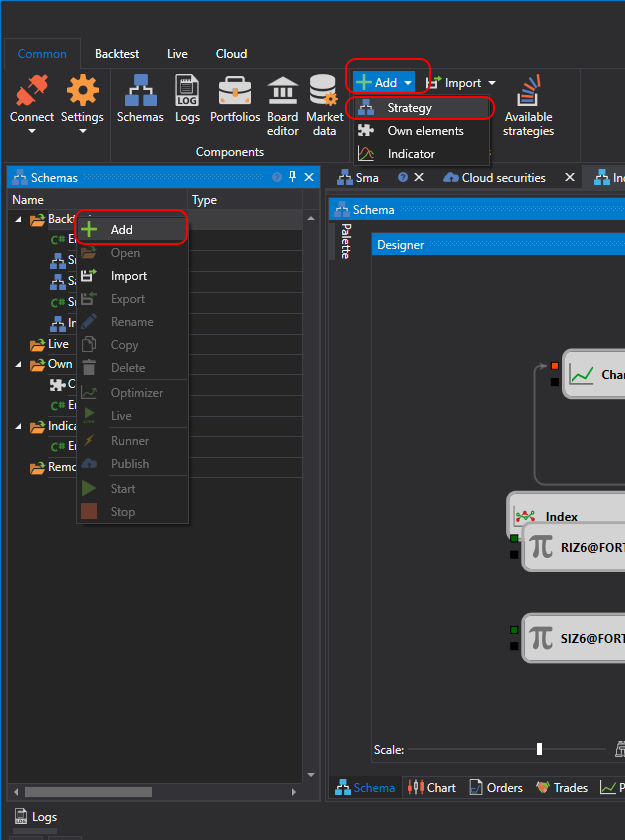
- Creating a new strategy from the cubes as described in Using Code. To add a new strategy by click the Add
 button in the Common tab and selecting Strategy. Or by right-click the Strategy folder in the Schemas panel, and to click the Add
  button in the drop-down menu.
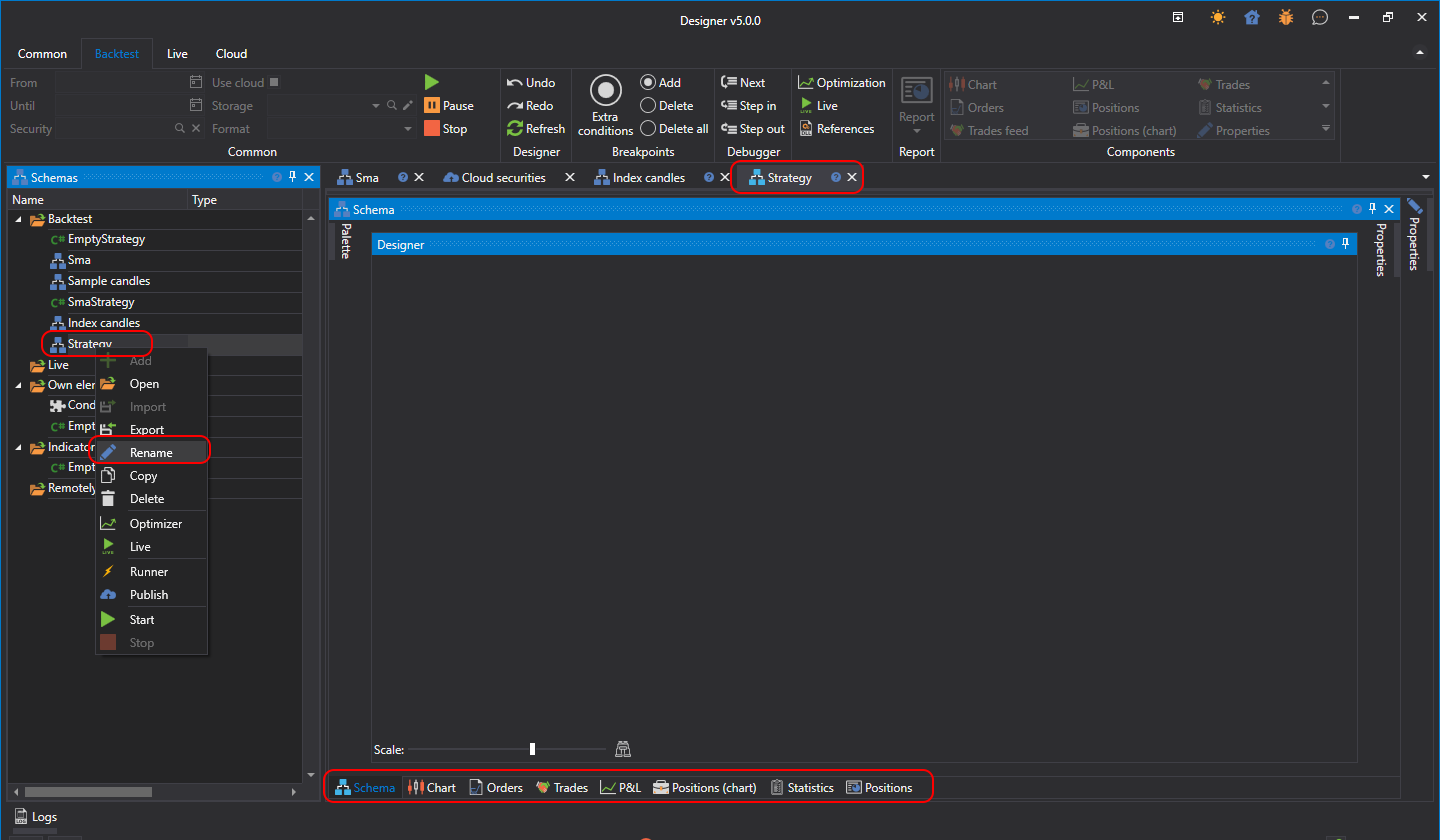
After clicking the Add  button in the Strategy folder of the Schemas panel, a new strategy will appear. In the workspace, a new tab with a strategy appears, when you switch to it, the Emulation tab will automatically open in the ribbon. In the Emulation tab, you can change the name of the strategy and give it a brief description.
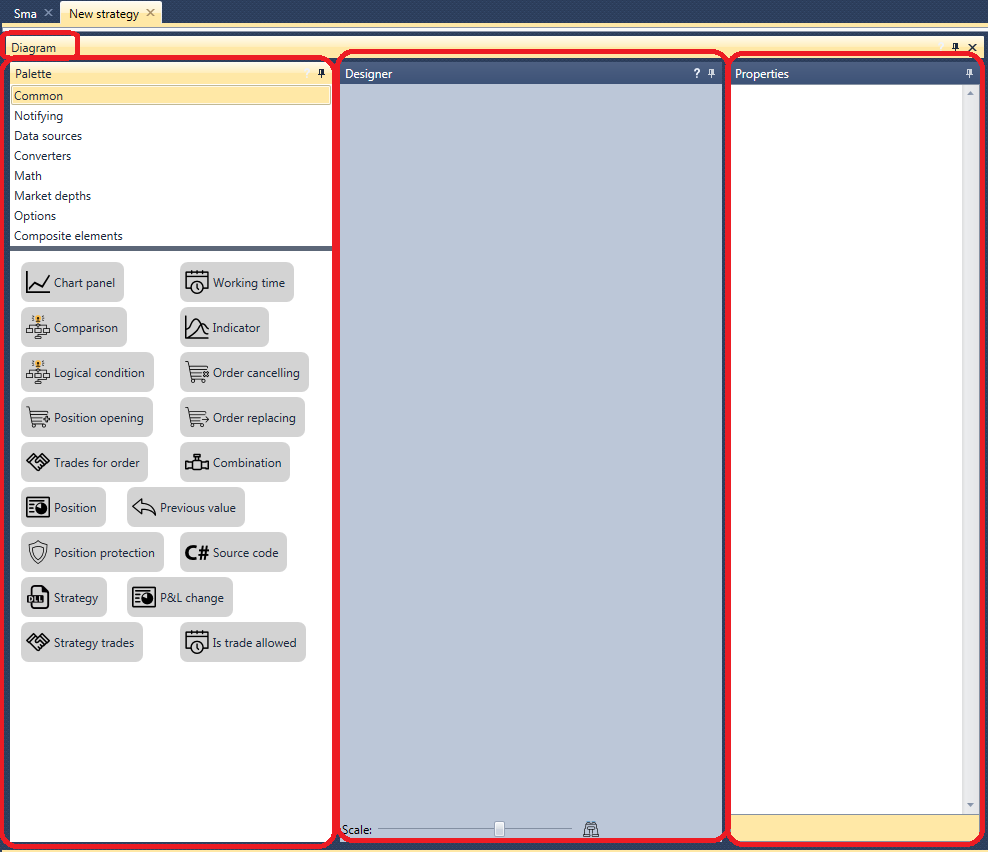
- For convenient work it is necessary to open and fix the Palette and Properties panels of the Schemas area by clicking the
 button. The result is a window of the following type.
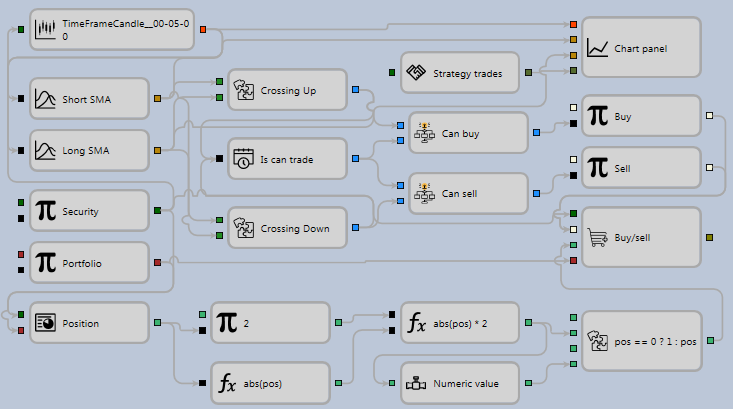
- The essence of the strategy of moving average (SMA) is as follows:
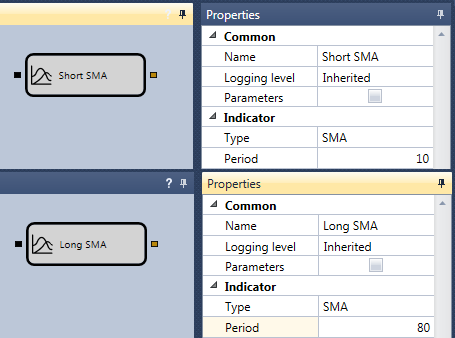
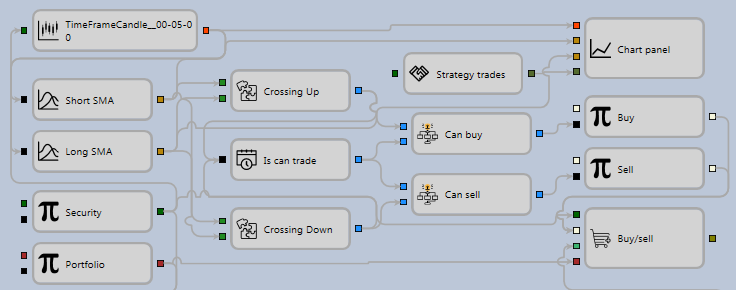
- There are two moving averages with different calculation periods, a long SMA and a short SMA. In the example, the Indicator cube of the long SMA is called Long SMA with a period of 80 candles, a short SMA is called Short SMA with a period of 10 candles.
- When a short moving average crosses a long one bottom-up, open a long position.
- When a short moving average crosses a long one top-down, open a short position.
- If there is an opposite position at the moment of receiving a signal to open a position, turn around the position.
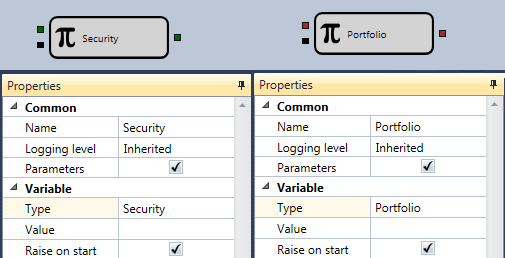
- For all strategies, you need an instrument and a portfolio, which will be used for trades. You should add them from the Palette panel to the Designer panel. In the example, the Variable cube with the Instrument type is called the Instrument, the Variable cube with the Portfolio type is called the Portfolio. Set the Parameters check box of Instrument and Portfolio cubes. When the check box is selected, the cube will take value from the strategy settings. If you do not select the check box, you should manually enter the instrument and portfolio values. If you leave the Value field of the Variable cube empty and do not set check box of parameters, the strategy during testing will give an error out about the unset value of the Variable cube.
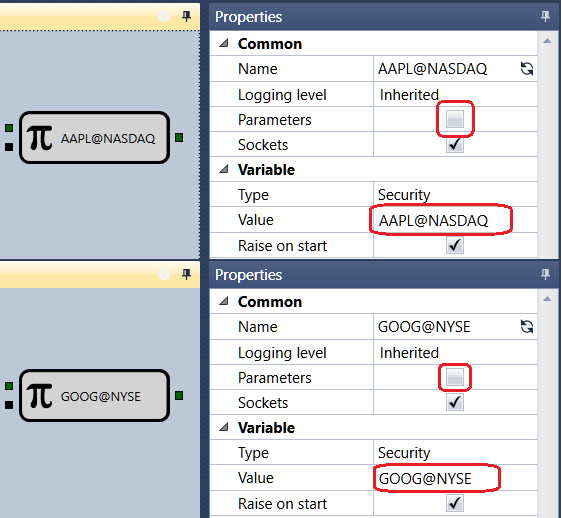
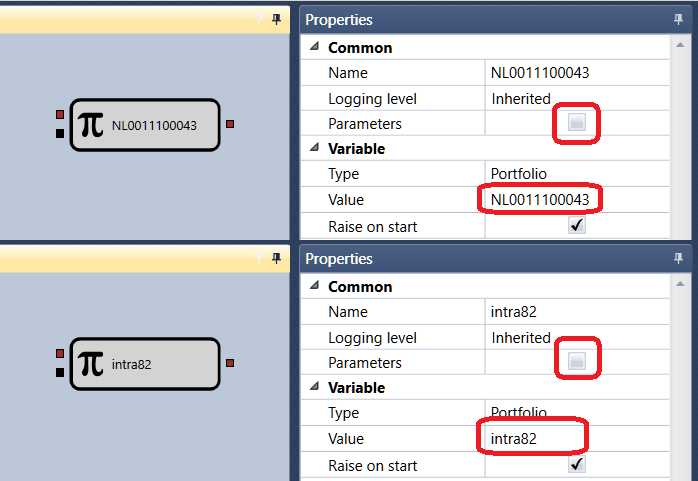
If you need to use several instruments or portfolios in the strategy, then for each cube you should uncheck the Parameters box and set the value of the instrument or portfolio.
- After adding the instrument and portfolio, you should add two Indicator cubes, select the SMA type, name the first Long SMA, set the period of 80 candles, name the second Short SMA, set the period of 10 candles.
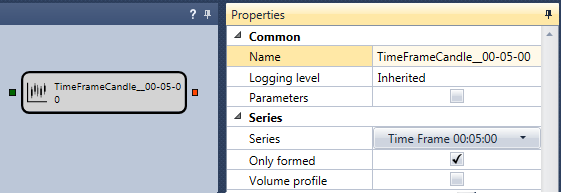
- For the indicators to work, it is necessary to pass to them a series of candles. To do this, you need to create the Candles cube. In the example, only formed candles with a timeframe of 5 minutes are used.
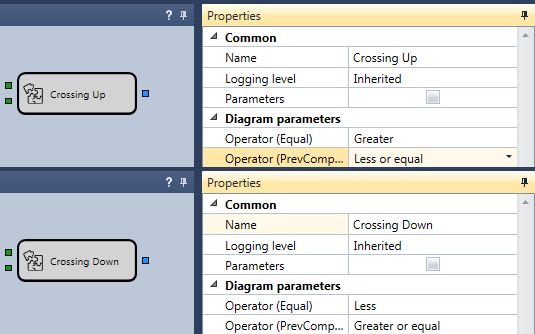
- After adding the indicators, you need to add two cubes that define the intersections of the indicators. These are the Crossing cubes from the composite elements. The first cube is called Crossing Up. It defines the intersection from bottom to top. The Short SMA indicator is passed to the upper input of the cube, and the Long SMA indicator to the lower input. The CurrComparison operator is set to a value larger, the PrevComparison operator is set to less than or equal to. The second cube is called Crossing Down, it defines the intersection from top to bottom. The Short SMA indicator is passed to the upper input of the cube, and the Long SMA indicator to the lower input. The CurrComparison operator is set to a value less, the PrevComparison operator is set to greater than or equal to.
- It is worth adding the Chart for a visual display of candles, indicators and trades. We will add to the Chart the elements of the display, candles, two indicators and trades.
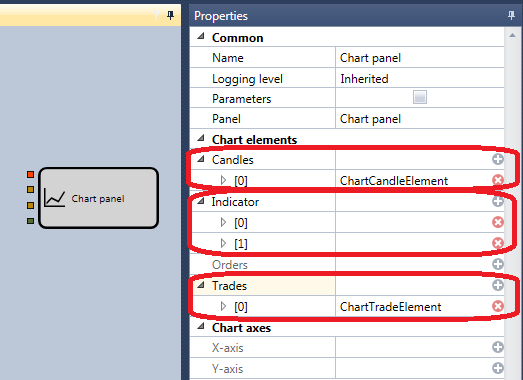
- As a source of trades for display on the chart the Trades cube of the strategy is used. The example is called Strategy trades.

- To open a position, add two Register order cubes. The first cube is for the purchase by a market order. The following are passed to the input of this cube: the Instrument, the signal for opening a position from the Crossing Up intersection cube, the Portfolio and the volume of the order. The second cube is for sale by a market order. The following are passed to the input of this cube: the Instrument, the signal for opening a position from the Crossing Down intersection cube, the Portfolio and the volume of the order.
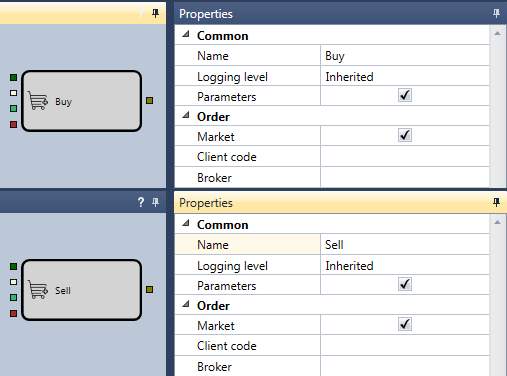
- By connecting the above elements with lines (Lines), a schema is obtained without taking into account the current position of the strategy. In such condition, it will gain an excessive amount of lots.
To control the position, you need to add the Position, cube to the input of which Instrument and Portfolio are passed.

To process the current position, you can use the ready-made schema described in the Get current position section. This schema determines the actual value of the required volume for the registering in the order. And if it is necessary to reverse the position, it will give twice the value of the portfolio.
- As a result, the completed strategy looks like:
