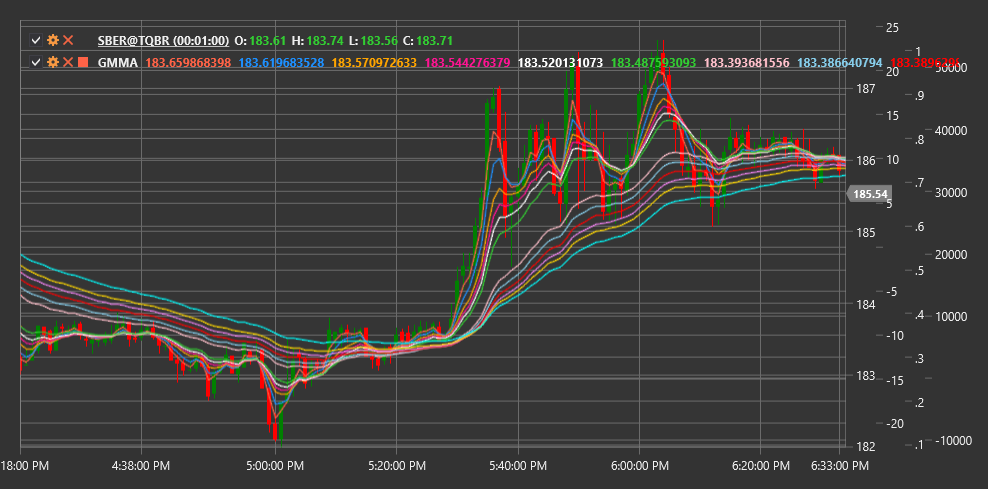
GMMA
Guppy Multiple Moving Average (GMMA) is a technical indicator developed by Daryl Guppy that uses two groups of exponential moving averages (EMA) to reveal the interaction between short-term traders and long-term investors.
To use the indicator, you need to use the GuppyMultipleMovingAverage class.
Description
The Guppy Multiple Moving Average (GMMA) consists of two groups of exponential moving averages (EMA):
- Short-term group (typically 3, 5, 8, 10, 12, and 15 periods) - represents short-term traders' activity
- Long-term group (typically 30, 35, 40, 45, 50, and 60 periods) - represents long-term investors' activity
GMMA allows visualization of the interaction between these two market participant groups and determines whether the market is in a trending or consolidation state. The indicator also helps identify moments when short-term traders begin to follow the same direction as long-term investors, which often indicates the formation or strengthening of a trend.
GMMA is particularly useful for:
- Determining the strength and direction of the current trend
- Identifying potential trend reversals
- Recognizing when the market transitions from consolidation to a trend
- Determining optimal entry points into an existing trend
Calculation
GMMA calculation involves computing two groups of exponential moving averages:
Short-term EMA group:
EMA_3 = EMA(Price, 3)
EMA_5 = EMA(Price, 5)
EMA_8 = EMA(Price, 8)
EMA_10 = EMA(Price, 10)
EMA_12 = EMA(Price, 12)
EMA_15 = EMA(Price, 15)
Long-term EMA group:
EMA_30 = EMA(Price, 30)
EMA_35 = EMA(Price, 35)
EMA_40 = EMA(Price, 40)
EMA_45 = EMA(Price, 45)
EMA_50 = EMA(Price, 50)
EMA_60 = EMA(Price, 60)
Where:
- EMA - exponential moving average
- Price - price (usually closing price)
Interpretation
GMMA interpretation involves analyzing both individual groups and their interaction:
Group Positioning:
- When the short-term group is above the long-term group, it indicates an upward trend
- When the short-term group is below the long-term group, it indicates a downward trend
Distance Between Groups:
- Large distance between groups indicates a strong trend
- Small distance or group crossover indicates a weak trend or consolidation
Compression and Expansion:
- Compression (convergence) of lines within a group indicates uncertainty and possible consolidation
- Expansion (divergence) of lines within a group indicates trend strengthening
Crossovers:
- Short-term group crossing through long-term group from bottom to top - strong bullish signal
- Short-term group crossing through long-term group from top to bottom - strong bearish signal
Direction Changes:
- When the long-term group begins to change direction, it indicates a significant change in long-term investor sentiment
- Short-term group reversal without changes in the long-term group often indicates a temporary correction
Optimal Entry Points:
- After strong expansion, compression may occur, indicating a correction within the trend
- The end of such compression (new expansion) can be a good entry point in the direction of the main trend
Early Reversal Warning:
- Short-term averages change direction first, then changes begin to appear in long-term averages
- Crossover between groups can serve as a trend reversal confirmation
