RC
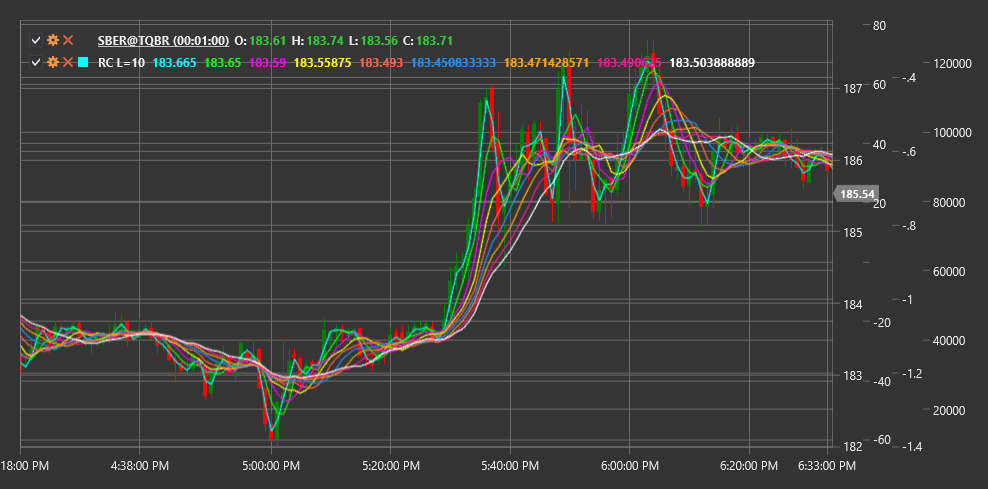
Rainbow Charts (RC) is a technical analysis indicator consisting of a set of moving averages with different periods displayed on a single chart. Visually, the indicator resembles a rainbow, hence its name.
To use the indicator, you need to use the RainbowCharts class.
Description
Rainbow Charts are based on using multiple moving averages (usually simple SMA) with progressively increasing periods. Different moving average lines are colored in different colors, creating a rainbow effect on the chart.
The indicator helps determine trend direction and strength:
- When lines diverge, this indicates trend strengthening
- When lines converge, this may signal trend weakening or a potential reversal
- When the price is above all lines, it indicates a strong upward trend
- When the price is below all lines, it indicates a strong downward trend
Parameters
- Lines - number of SMA moving averages used in the rainbow chart.
Calculation
Rainbow Charts consist of multiple moving averages (SMA), with each subsequent line's period increasing by a certain step. For n lines with a base period p, periods are calculated as:
Period(i) = p + i * step
Where:
- i - line number (from 0 to n-1)
- step - period increase step (usually 1)
