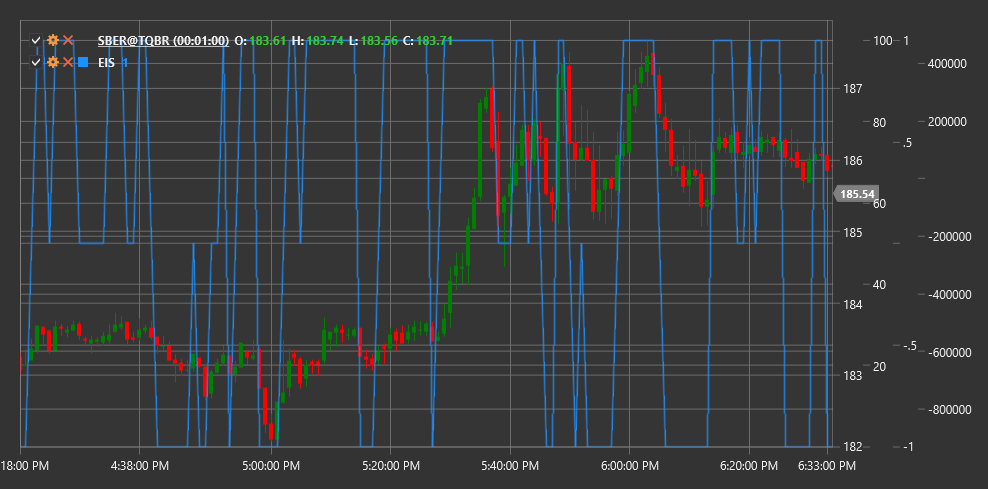
EIS
Elder Impulse System (EIS) is a technical indicator developed by Dr. Alexander Elder that combines a trend indicator and a momentum oscillator to determine the direction and strength of market movement.
To use the indicator, you need to use the ElderImpulseSystem class.
Description
The Elder Impulse System (EIS) is a simple yet powerful tool for visualizing market momentum. It combines two indicators:
- Exponential Moving Average (EMA) - to determine trend direction
- MACD Histogram - to measure price movement strength and momentum
EIS classifies each candle on the price chart into one of three categories (usually denoted by different colors):
- Green (strong bullish impulse) - when both indicators are rising
- Red (strong bearish impulse) - when both indicators are falling
- Blue or neutral (no clear impulse) - when indicators move in opposite directions
EIS is particularly useful for:
- Quickly visually determining trend direction and strength
- Identifying entry and exit points in the direction of the main trend
- Identifying potential reversal points
- Filtering out false signals
Calculation
Elder Impulse System calculation involves the following steps:
Calculate 13-period exponential moving average (EMA):
EMA = EMA(Close, 13)Calculate MACD Histogram (standard values: 12, 26, 9):
MACD Line = EMA(Close, 12) - EMA(Close, 26)
Signal Line = EMA(MACD Line, 9)
MACD Histogram = MACD Line - Signal Line
Determine color classification for the current candle:
If EMA[current] > EMA[previous] AND MACD Histogram[current] > MACD Histogram[previous], then Green (Bullish Impulse)
If EMA[current] < EMA[previous] AND MACD Histogram[current] < MACD Histogram[previous], then Red (Bearish Impulse)
Otherwise Blue (No Impulse)
Interpretation
The Elder Impulse System is interpreted as follows:
Green Candles (strong bullish impulse):
- Indicate a strong upward momentum
- Best time to buy or hold long positions
- A series of green candles indicates a strong upward trend
Red Candles (strong bearish impulse):
- Indicate a strong downward momentum
- Best time to sell or hold short positions
- A series of red candles indicates a strong downward trend
Blue Candles (no clear impulse):
- Indicate uncertainty or consolidation
- Signal a possible slowdown or trend reversal
- Often appear during consolidation periods or before a trend change
Trading Strategies:
- Buy when candles change color from blue to green
- Sell when candles change color from blue to red
- Close long positions when candles change color from green to any other
- Close short positions when candles change color from red to any other
Trend Confirmation:
- A sequence of green candles confirms an upward trend
- A sequence of red candles confirms a downward trend
- Color alternation indicates a sideways trend or uncertainty
