MACD Histogram
Moving Averages Convergence-Divergence (MACD) is a momentum indicator that shows the relationship between two moving averages of a security's price, presented as a histogram.
To use the indicator, the MovingAverageConvergenceDivergenceHistogram class should be used.
Three exponential moving averages with different periods are used to calculate the indicator. The fast moving average with a shorter period (EMA_s) is subtracted from the slow moving average with a longer period (EMA_l). The MACD line is constructed from the obtained values.
MACD = EMA_s(P) − EMA_l(P)
The default periods are 12 and 26. This line is then smoothed by a third exponential moving average (EMA_a), typically with a period of 9, resulting in the so-called MACD signal line (Signal).
Signal = EMA_a(EMA_s(P) − EMA_l(P))
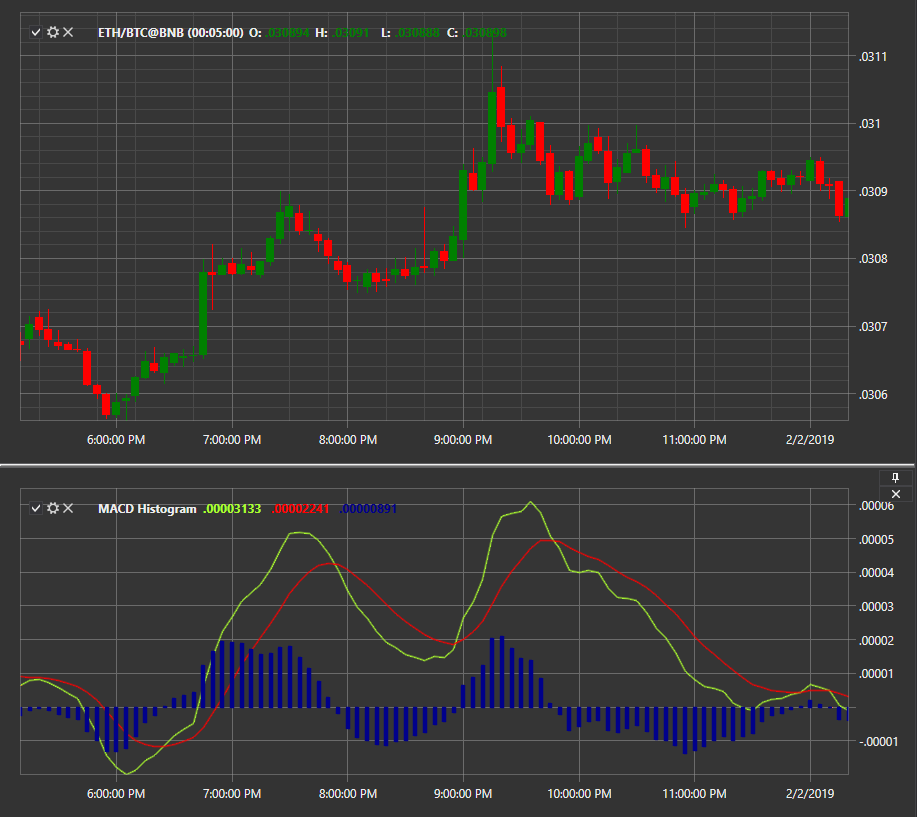
These two resulting curves represent the regular linear MACD. Also, the zero line, relative to which the curves fluctuate, is usually marked in the indicator window.
When constructing the MACD Histogram (MACD Histogram), the histogram bars show the difference between the Signal and MACD lines, further simplifying the perception of the indicator.