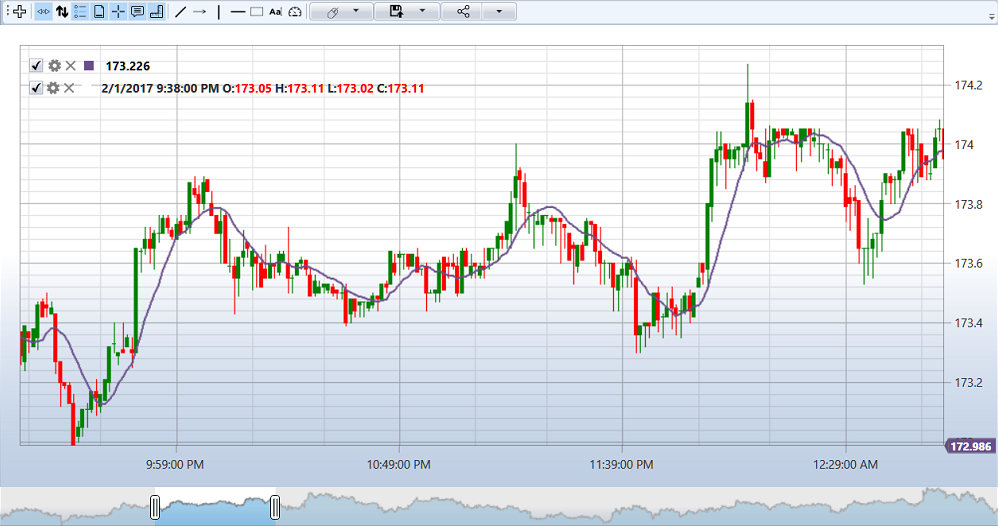
Adding an Indicator to the Chart
The following example demonstrates how to add an indicator for drawing on a chart:
private readonly Connector _connector = new Connector();
private Security _security;
private Subscription _candleSubscription;
private SimpleMovingAverage _sma;
readonly TimeSpan _timeFrame = TimeSpan.FromMinutes(1);
private ChartArea _area;
private ChartCandleElement _candlesElem;
private ChartIndicatorElement _longMaElem;

// Initializing chart and indicator
private void InitializeChart()
{
	// _chart - StockSharp.Xaml.Charting.Chart
	// Creating a chart area
	_area = new ChartArea();
	_chart.Areas.Add(_area);

	// Creating a chart element representing candles
	_candlesElem = new ChartCandleElement();
	_area.Elements.Add(_candlesElem);

	// Creating a chart element representing the indicator
	_longMaElem = new ChartIndicatorElement
	{
		Title = "Long"
	};
	_area.Elements.Add(_longMaElem);

	// Creating an indicator
	_sma = new SimpleMovingAverage() { Length = 80 };

	// Subscribing to the candle receiving event
	_connector.CandleReceived += OnCandleReceived;
}

// Method for subscribing to candles
private void SubscribeToCandles()
{
	// Creating a subscription to candles with the specified timeframe
	_candleSubscription = new Subscription(
		DataType.TimeFrame(_timeFrame),
		_security)
	{
		MarketData =
		{
			// Requesting historical data for 30 days
			From = DateTime.Today.Subtract(TimeSpan.FromDays(30)),
			To = DateTime.Now,
			// Receiving only finished candles
			IsFinishedOnly = true
		}
	};

	// Starting the subscription
	_connector.Subscribe(_candleSubscription);
}

// Handler for the candle receiving event
private void OnCandleReceived(Subscription subscription, ICandleMessage candle)
{
	// Checking if the candle belongs to our subscription
	if (subscription != _candleSubscription)
		return;

	// Checking the candle state
	if (candle.State != CandleStates.Finished)
		return;

	// Processing the candle with the indicator
	var longValue = _sma.Process(candle);

	// Creating data for drawing
	var data = new ChartDrawData();
	data
		.Group(candle.OpenTime)
			.Add(_candlesElem, candle)
			.Add(_longMaElem, longValue);

	// Drawing on the chart in the UI thread
	this.GuiAsync(() => _chart.Draw(data));
}

// Method for unsubscribing when closing the window
private void UnsubscribeFromCandles()
{
	if (_candleSubscription != null)
	{
		_connector.CandleReceived -= OnCandleReceived;
		_connector.UnSubscribe(_candleSubscription);
		_candleSubscription = null;
	}
}
Example of working with multiple indicators
private readonly Connector _connector = new Connector();
private Security _security;
private Subscription _candleSubscription;
private SimpleMovingAverage _shortSma;
private SimpleMovingAverage _longSma;
private ChartArea _mainArea;
private ChartArea _indicatorArea;
private ChartCandleElement _candlesElem;
private ChartIndicatorElement _shortSmaElem;
private ChartIndicatorElement _longSmaElem;
private RelativeStrengthIndex _rsi;
private ChartIndicatorElement _rsiElem;

// Initializing chart and indicators
private void InitializeChartWithMultipleIndicators()
{
	// Creating the main area for candles and moving averages
	_mainArea = new ChartArea();
	_chart.Areas.Add(_mainArea);

	// Creating an area for RSI
	_indicatorArea = new ChartArea();
	_chart.Areas.Add(_indicatorArea);

	// Creating chart elements
	_candlesElem = new ChartCandleElement();
	_shortSmaElem = new ChartIndicatorElement { Title = "SMA (short)" };
	_longSmaElem = new ChartIndicatorElement { Title = "SMA (long)" };
	_rsiElem = new ChartIndicatorElement { Title = "RSI" };

	// Setting element colors
	_shortSmaElem.Color = Colors.Red;
	_longSmaElem.Color = Colors.Blue;
	_rsiElem.Color = Colors.Green;

	// Adding elements to their respective areas
	_mainArea.Elements.Add(_candlesElem);
	_mainArea.Elements.Add(_shortSmaElem);
	_mainArea.Elements.Add(_longSmaElem);
	_indicatorArea.Elements.Add(_rsiElem);

	// Creating indicators
	_shortSma = new SimpleMovingAverage { Length = 9 };
	_longSma = new SimpleMovingAverage { Length = 20 };
	_rsi = new RelativeStrengthIndex { Length = 14 };

	// Subscribing to the candle receiving event
	_connector.CandleReceived += OnCandleReceivedMultipleIndicators;

	// Creating a subscription to candles
	_candleSubscription = new Subscription(
		DataType.TimeFrame(TimeSpan.FromMinutes(5)),
		_security)
	{
		MarketData =
		{
			From = DateTime.Today.Subtract(TimeSpan.FromDays(30)),
			To = DateTime.Now,
			IsFinishedOnly = true
		}
	};

	// Starting the subscription
	_connector.Subscribe(_candleSubscription);
}

// Handler for the candle receiving event for multiple indicators
private void OnCandleReceivedMultipleIndicators(Subscription subscription, ICandleMessage candle)
{
	// Checking if the candle belongs to our subscription
	if (subscription != _candleSubscription)
		return;

	if (candle.State != CandleStates.Finished)
		return;

	// Processing the candle with indicators
	var shortSmaValue = _shortSma.Process(candle);
	var longSmaValue = _longSma.Process(candle);
	var rsiValue = _rsi.Process(candle);

	// Creating data for drawing
	var data = new ChartDrawData();
	data
		.Group(candle.OpenTime)
			.Add(_candlesElem, candle)
			.Add(_shortSmaElem, shortSmaValue)
			.Add(_longSmaElem, longSmaValue)
			.Add(_rsiElem, rsiValue);

	// Drawing on the chart in the UI thread
	this.GuiAsync(() => _chart.Draw(data));
}