Volume Profile
The "Volume Profile" script serves as a tool for analyzing the distribution of trading volume across price levels over a selected period. It enables traders and quantitative analysts to visualize and examine where the main trading activity was concentrated in terms of price levels.
Functionality Description
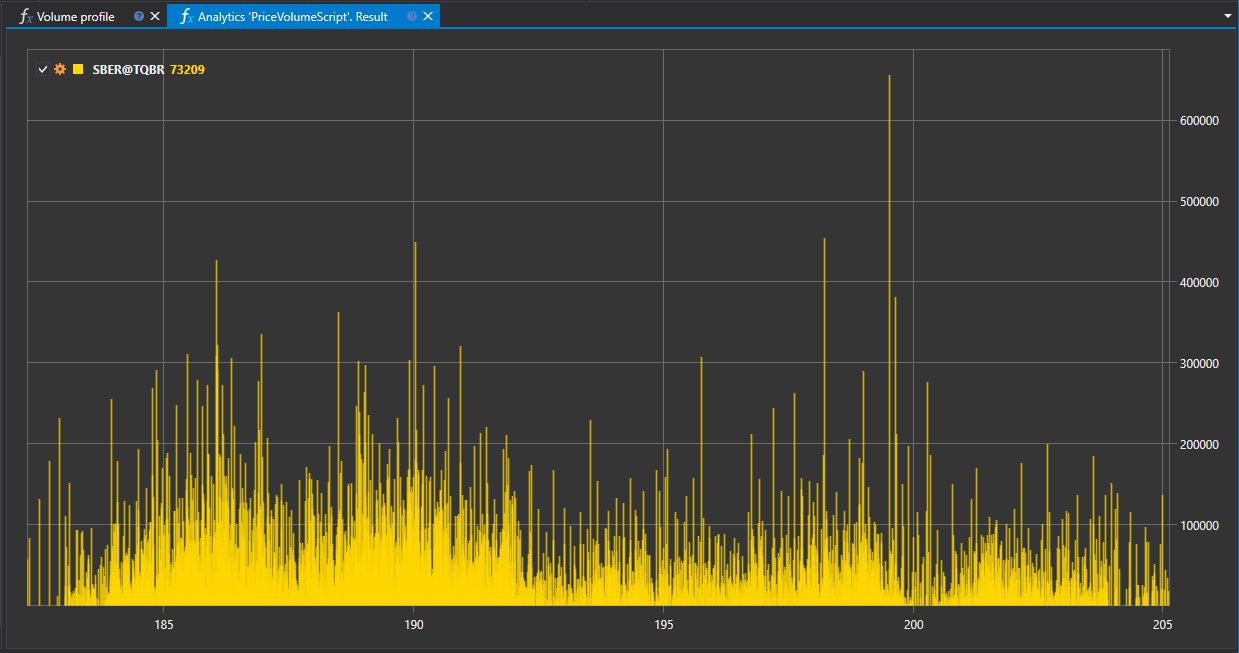
The script aggregates transaction data to form a profile that displays the volumes executed at various price levels. This information can be represented on a chart, illustrating the density of trades across different price points.
Practical Significance
Analyzing the volume profile helps in identifying key demand and supply zones and can be used for:
- Identifying support and resistance levels where the instrument finds significant interest from market participants.
- Assessing the strength of the current trend or its potential weakening, based on the change in volume distribution.
- Planning entry and exit points from the market, considering levels with maximum accumulated liquidity.
Application in Trading and Quantitative Analysis
- Trading: The volume profile can be utilized to develop strategies based on volume analysis, providing a clear view of where the main trading operations occur.
- Quantitative Analysis: Data on volume distribution can serve as input for quantitative models predicting the likelihood of price movements based on the volume accumulated at a level.
Script Implementation
The "Volume Profile" script performs the following steps:
- Data Collection: The script aggregates transaction data for the specified period.
- Profile Formation: Based on the collected data, the script forms a volume profile reflecting trading activity at each price level.
- Visualization: The results of the script's operation are visualized as a chart or histogram, where each bar corresponds to a specific price level and its trading volume.
Utilizing the "Volume Profile" script within the StockSharp platform allows for comprehensive market analysis, building well-founded trading hypotheses, and improving the quality of trading decisions made.
Script Code on C#
namespace StockSharp.Algo.Analytics
{
	/// <summary>
	/// The analytic script, calculating distribution of the volume by price levels.
	/// </summary>
	public class PriceVolumeScript : IAnalyticsScript
	{
		Task IAnalyticsScript.Run(ILogReceiver logs, IAnalyticsPanel panel, SecurityId[] securities, DateTime from, DateTime to, IStorageRegistry storage, IMarketDataDrive drive, StorageFormats format, DataType dataType, CancellationToken cancellationToken)
		{
			if (securities.Length == 0)
			{
				logs.LogWarning("No instruments.");
				return Task.CompletedTask;
			}

			// script can process only 1 instrument
			var security = securities.First();

			// get candle storage
			var candleStorage = storage.GetCandleMessageStorage(security, dataType, drive, format);

			// get available dates for the specified period
			var dates = candleStorage.GetDates(from, to).ToArray();

			if (dates.Length == 0)
			{
				logs.LogWarning("no data");
				return Task.CompletedTask;
			}

			// grouping candles by middle price
			var rows = candleStorage.Load(from, to)
				.GroupBy(c => c.LowPrice + c.GetLength() / 2)
				.ToDictionary(g => g.Key, g => g.Sum(c => c.TotalVolume));

			// draw on chart
			panel.CreateChart<decimal, decimal>()
				.Append(security.ToStringId(), rows.Keys, rows.Values, DrawStyles.Histogram);

			return Task.CompletedTask;
		}
	}
}
Script Code on Python
import clr

# Add .NET references
clr.AddReference("StockSharp.Messages")
clr.AddReference("StockSharp.Algo.Analytics")
clr.AddReference("Ecng.Drawing")

from Ecng.Drawing import DrawStyles
from System.Threading.Tasks import Task
from StockSharp.Algo.Analytics import IAnalyticsScript
from storage_extensions import *
from candle_extensions import *
from chart_extensions import *
from indicator_extensions import *

# The analytic script, calculating distribution of the volume by price levels.
class price_volume_script(IAnalyticsScript):
	def Run(
		self,
		logs,
		panel,
		securities,
		from_date,
		to_date,
		storage,
		drive,
		format,
		data_type,
		cancellation_token
	):
		# Check if there are no instruments
		if not securities:
			logs.LogWarning("No instruments.")
			return Task.CompletedTask

		# Script can process only 1 instrument
		security = securities[0]

		if data_type is None:
			logs.LogWarning(f"Unsupported data type {data_type}.")
			return Task.CompletedTask

		message_type = data_type.MessageType

		# Get candle storage
		candle_storage = get_candle_storage(storage, security, data_type, drive, format)

		# Get available dates for the specified period
		dates = get_dates(candle_storage, from_date, to_date)

		if len(dates) == 0:
			logs.LogWarning("no data")
			return Task.CompletedTask

		# Grouping candles by middle price and summing their volumes
		candles = load_range(candle_storage, message_type, from_date, to_date)
		rows_dict = {}
		for candle in candles:
			# Calculate middle price of the candle
			key = candle.LowPrice + get_length(candle) / 2
			# Sum volumes for same price level
			rows_dict[key] = rows_dict.get(key, 0) + candle.TotalVolume

		# Draw on chart
		chart = create_chart(panel, float, float)
		chart.Append(to_string_id(security), list(rows_dict.keys()), list(rows_dict.values()), DrawStyles.Histogram)

		return Task.CompletedTask