Closing Price Normalization
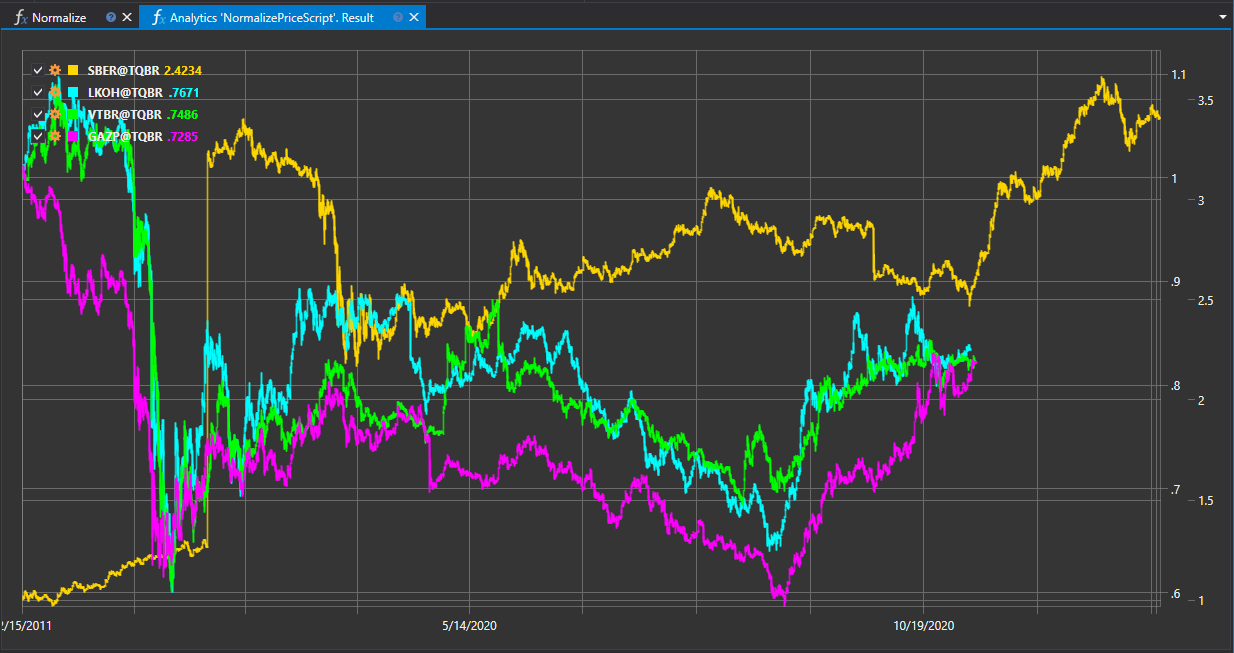
The "Closing Price Normalization" script is designed to standardize the closing prices of financial instruments, enabling comparison and analysis of different assets on a unified scale. This is particularly useful when comparing instruments with varying costs and volatility.
Script Operation Description
The script adapts closing price data by scaling or transforming them according to the selected normalization method. The result is a set of standardized values that can be used for quantitative comparison and multi-instrument analysis.
Application of Normalization
- Price Scale Unification: Normalization helps bring data from various instruments to a single scale, simplifying visual comparison and analytical assessment.
- Correlation Analysis: Standardized data allows for the identification of correlational relationships between assets and the formation of diversified portfolios.
- Index and Model Creation: Normalized prices are used to create composite indices, pricing models, and other quantitative research.
Normalization Methodology
Normalization may include the following methods:
- Scaling: Adjusting closing prices to a certain range of values, such as from 0 to 1.
- Z-score: Transforming closing prices using the Z-score, which indicates how many standard deviations a value deviates from the mean.
- Logarithmization: Applying logarithmic transformation to smooth out data dispersion and reduce the impact of extreme values.
Script Implementation
The normalization process typically includes the following steps:
- Normalization Selection: Determining the normalization method based on the analysis goals and data characteristics.
- Data Processing: Applying the chosen normalization method to the closing prices for each instrument.
- Results Analysis: Using normalized data for subsequent analysis and comparison of instruments.
The "Closing Price Normalization" script is a crucial tool for preparing data for trading and quantitative analysis, allowing traders and analysts to more accurately compare and evaluate financial assets within various strategies and studies.
Script Code on C#
namespace StockSharp.Algo.Analytics
{
	/// <summary>
	/// The analytic script, normalize securities close prices and shows on same chart.
	/// </summary>
	public class NormalizePriceScript : IAnalyticsScript
	{
		Task IAnalyticsScript.Run(ILogReceiver logs, IAnalyticsPanel panel, SecurityId[] securities, DateTime from, DateTime to, IStorageRegistry storage, IMarketDataDrive drive, StorageFormats format, DataType dataType, CancellationToken cancellationToken)
		{
			if (securities.Length == 0)
			{
				logs.LogWarning("No instruments.");
				return Task.CompletedTask;
			}

			var chart = panel.CreateChart<DateTimeOffset, decimal>();

			foreach (var security in securities)
			{
				// stop calculation if user cancel script execution
				if (cancellationToken.IsCancellationRequested)
					break;

				var series = new Dictionary<DateTimeOffset, decimal>();

				// get candle storage
				var candleStorage = storage.GetCandleMessageStorage(security, dataType, drive, format);

				decimal? firstClose = null;

				foreach (var candle in candleStorage.Load(from, to))
				{
					firstClose ??= candle.ClosePrice;

					// normalize close prices by dividing on first close
					series[candle.OpenTime] = candle.ClosePrice / firstClose.Value;
				}

				// draw series on chart
				chart.Append(security.ToStringId(), series.Keys, series.Values);
			}

			return Task.CompletedTask;
		}
	}
}
Script Code on Python
import clr

# Add .NET references
clr.AddReference("StockSharp.Messages")
clr.AddReference("StockSharp.Algo.Analytics")
clr.AddReference("Ecng.Drawing")

from Ecng.Drawing import DrawStyles
from System.Threading.Tasks import Task
from StockSharp.Algo.Analytics import IAnalyticsScript
from storage_extensions import *
from candle_extensions import *
from chart_extensions import *
from indicator_extensions import *

# The analytic script, normalize securities close prices and shows on same chart.
class normalize_price_script(IAnalyticsScript):
	def Run(self, logs, panel, securities, from_date, to_date, storage, drive, format, data_type, cancellation_token):
		if not securities:
			logs.LogWarning("No instruments.")
			return Task.CompletedTask

		chart = create_chart(panel, datetime, float)

		if data_type is None:
			logs.LogWarning(f"Unsupported data type {data_type}.")
			return Task.CompletedTask

		message_type = data_type.MessageType

		for security in securities:
			# stop calculation if user cancel script execution
			if cancellation_token.IsCancellationRequested:
				break

			series = {}

			# get candle storage
			candle_storage = get_candle_storage(storage, security, data_type, drive, format)

			first_close = None

			for candle in load_range(candle_storage, message_type, from_date, to_date):
				if first_close is None:
					first_close = candle.ClosePrice

				# normalize close prices by dividing on first close
				series[candle.OpenTime] = candle.ClosePrice / first_close

			# draw series on chart
			chart.Append(to_string_id(security), list(series.keys()), list(series.values()))

		return Task.CompletedTask