Largest Candles
The "Largest Candles" script is designed to identify candles with the maximum volume and the greatest body length on the charts of selected financial instruments over a given period. This tool allows traders and analysts to identify significant market events and the reaction of market participants.
Key Features
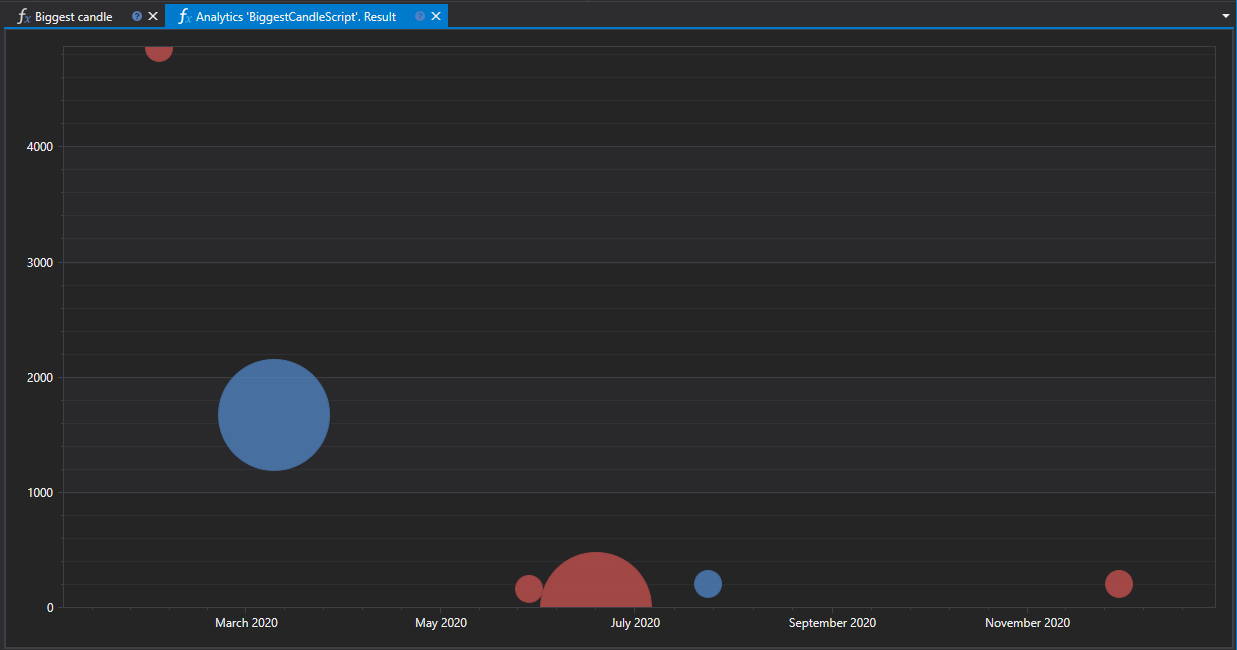
The script analyzes a set of specified instruments, searches among them for candles with the greatest volume and body length, and displays this data on two graphs:
- Candle Body Length Chart: Shows candles with the greatest difference between the opening and closing price.
- Trading Volume Chart: Demonstrates candles with the maximum trading volume for the existence time of the candle.
Workflow
- Selection of Instruments and Analysis Period: Determines the list of instruments and the time interval for analysis.
- Data Analysis: Involves loading and analyzing historical candle data to identify candles with the greatest indicators.
- Visualization of Results: Found candles are displayed on charts in the analytics panel interface.
Application
- Market Activity Analysis: Helps to determine moments of the greatest trader activity and potential market reversals.
- Key Levels Identification: Candles with significant volume and body length often form around key support and resistance levels.
- Strategic Planning: Information about the largest candles can be used for planning entry and exit points from the market, considering potential volatility.
Script Code on C#
namespace StockSharp.Algo.Analytics
{
	/// <summary>
	/// The analytic script, shows biggest candle (by volume and by length) for specified securities.
	/// </summary>
	public class BiggestCandleScript : IAnalyticsScript
	{
		Task IAnalyticsScript.Run(ILogReceiver logs, IAnalyticsPanel panel, SecurityId[] securities, DateTime from, DateTime to, IStorageRegistry storage, IMarketDataDrive drive, StorageFormats format, TimeSpan timeFrame, CancellationToken cancellationToken)
		{
			if (securities.Length == 0)
			{
				logs.AddWarningLog("No instruments.");
				return Task.CompletedTask;
			}

			var priceChart = panel.CreateChart<DateTimeOffset, decimal, decimal>();
			var volChart = panel.CreateChart<DateTimeOffset, decimal, decimal>();

			var bigPriceCandles = new List<CandleMessage>();
			var bigVolCandles = new List<CandleMessage>();

			foreach (var security in securities)
			{
				// stop calculation if user cancel script execution
				if (cancellationToken.IsCancellationRequested)
					break;

				// get candle storage
				var candleStorage = storage.GetTimeFrameCandleMessageStorage(security, timeFrame, drive, format);

				var allCandles = candleStorage.Load(from, to).ToArray();

				// first orders by volume desc will be our biggest candle
				var bigPriceCandle = allCandles.OrderByDescending(c => c.GetLength()).FirstOrDefault();
				var bigVolCandle = allCandles.OrderByDescending(c => c.TotalVolume).FirstOrDefault();

				if (bigPriceCandle != null)
					bigPriceCandles.Add(bigPriceCandle);

				if (bigVolCandle != null)
					bigVolCandles.Add(bigVolCandle);
			}

			// draw series on chart
			priceChart.Append("prices", bigPriceCandles.Select(c => c.OpenTime), bigPriceCandles.Select(c => c.GetMiddlePrice(null)), bigPriceCandles.Select(c => c.GetLength()));
			volChart.Append("prices", bigVolCandles.Select(c => c.OpenTime), bigPriceCandles.Select(c => c.GetMiddlePrice(null)), bigVolCandles.Select(c => c.TotalVolume));

			return Task.CompletedTask;
		}
	}
}
Script Code on Python
import clr

# Add .NET references
clr.AddReference("StockSharp.Messages")
clr.AddReference("StockSharp.Algo.Analytics")
clr.AddReference("Ecng.Drawing")

from Ecng.Drawing import DrawStyles
from System import TimeSpan
from System.Threading.Tasks import Task
from StockSharp.Algo.Analytics import IAnalyticsScript
from storage_extensions import *
from candle_extensions import *
from chart_extensions import *
from indicator_extensions import *

# The analytic script, shows biggest candle (by volume and by length) for specified securities.
class biggest_candle_script(IAnalyticsScript):
	def Run(self, logs, panel, securities, from_date, to_date, storage, drive, format, time_frame, cancellation_token):
		if not securities:
			logs.LogWarning("No instruments.")
			return Task.CompletedTask

		price_chart = create_3d_chart(panel, datetime, float, float)
		vol_chart = create_3d_chart(panel, datetime, float, float)

		big_price_candles = []
		big_vol_candles = []

		for security in securities:
			# stop calculation if user cancel script execution
			if cancellation_token.IsCancellationRequested:
				break

			# get candle storage
			candle_storage = get_tf_candle_storage(storage, security, time_frame, drive, format)
			all_candles = load_tf_candles(candle_storage, from_date, to_date)

			if len(all_candles) > 0:
				# first orders by volume desc will be our biggest candle
				big_price_candle = max(all_candles, key=lambda c: get_length(c))
				big_vol_candle = max(all_candles, key=lambda c: c.TotalVolume)

				if big_price_candle is not None:
					big_price_candles.append(big_price_candle)

				if big_vol_candle is not None:
					big_vol_candles.append(big_vol_candle)

		# draw series on chart
		price_chart.Append(
			"prices",
			[c.OpenTime for c in big_price_candles],
			[get_middle_price(c) for c in big_price_candles],
			[get_length(c) for c in big_price_candles]
		)

		vol_chart.Append(
			"prices",
			[c.OpenTime for c in big_vol_candles],
			[get_middle_price(c) for c in big_price_candles],
			[c.TotalVolume for c in big_vol_candles]
		)

		return Task.CompletedTask