Creating a Script
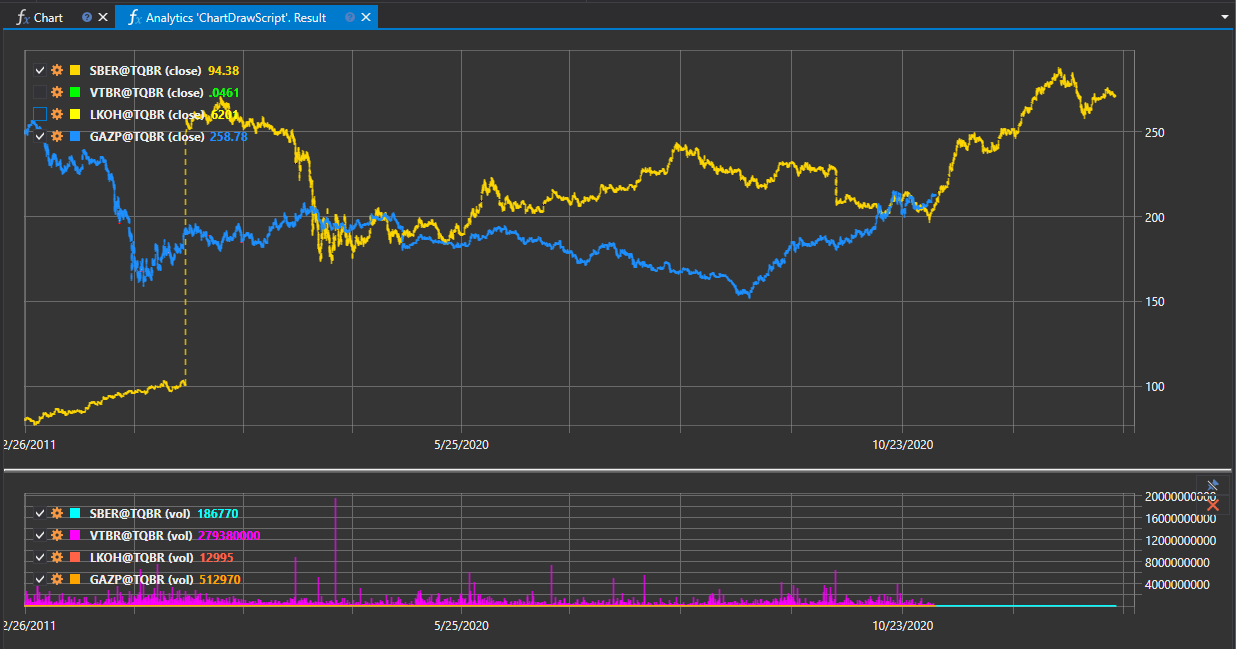
Analytics allows creating your own scripts. As an example, let's review the ChartDrawScript, which demonstrates the capabilities of chart drawing:
namespace StockSharp.Algo.Analytics
{
	/// <summary>
	/// The analytic script, shows chart drawing possibilities.
	/// </summary>
	public class ChartDrawScript : IAnalyticsScript
	{
		Task IAnalyticsScript.Run(ILogReceiver logs, IAnalyticsPanel panel, SecurityId[] securities, DateTime from, DateTime to, IStorageRegistry storage, IMarketDataDrive drive, StorageFormats format, DataType dataType, CancellationToken cancellationToken)
		{
			if (securities.Length == 0)
			{
				logs.LogWarning("No instruments.");
				return Task.CompletedTask;
			}

			var lineChart = panel.CreateChart<DateTimeOffset, decimal>();
			var histogramChart = panel.CreateChart<DateTimeOffset, decimal>();

			foreach (var security in securities)
			{
				// stop calculation if user cancel script execution
				if (cancellationToken.IsCancellationRequested)
					break;

				var candlesSeries = new Dictionary<DateTimeOffset, decimal>();
				var volsSeries = new Dictionary<DateTimeOffset, decimal>();

				// get candle storage
				var candleStorage = storage.GetCandleMessageStorage(security, dataType, drive, format);

				foreach (var candle in candleStorage.Load(from, to))
				{
					// fill series
					candlesSeries[candle.OpenTime] = candle.ClosePrice;
					volsSeries[candle.OpenTime] = candle.TotalVolume;
				}

				// draw series on chart as line and histogram
				lineChart.Append($"{security} (close)", candlesSeries.Keys, candlesSeries.Values, DrawStyles.DashedLine);
				histogramChart.Append($"{security} (vol)", volsSeries.Keys, volsSeries.Values, DrawStyles.Histogram);
			}

			return Task.CompletedTask;
		}
	}
}
Overview
This script is designed to draw charts based on the price and volume data of financial instruments over a specific time period. It implements the IAnalyticsScript interface, which defines a contract for any analytical script that can be executed in the Hydra program.
IAnalyticsScript Interface
The IAnalyticsScript interface ensures that any implementing analytical script will have the Run method, which is necessary for performing the script's analytical operations.
Run Method
The Run method is the entry point of an analytical script, where actual data processing and analytical operations are performed.
Parameters:
logs: Takes an instance of ILogReceiver for logging within the script.panel: Provides IAnalyticsPanel, which is a user interface element for drawing charts and displaying results.securities: An array of SecurityId identifying the financial instruments for analysis.from: The start date of the data range for analysis.to: The end date of the data range for analysis.storage: An instance of IStorageRegistry allowing access to the market data storage.drive: Represents IMarketDataDrive to specify the location of market data storage.format: A StorageFormats value indicating the market data format.dataType: DataType describing the requested market data type and its parameters (for example, the candle time-frame).cancellationToken: CancellationToken monitoring for cancellation requests.
Returns:
- Task, representing the asynchronous operation of the analytical script.
Implementation Details
The ChartDrawScript class specifically processes market data for each provided security. It creates two types of charts: a line chart for closing prices and a histogram for volume data.
Main Processing Stages:
- Check for the presence of instruments to process. If none are available, log a warning and complete the task.
- Create a line chart and a histogram using the IAnalyticsPanel.CreateChart method.
- Iterate through each security and check for cancellation requests.
- Get the candle storage using the
storage.GetCandleMessageStoragemethod. - Load candle data within the specified date range.
- Fill dictionaries with open time series data, corresponding closing prices, and total volumes.
- Draw series data on charts using
lineChart.AppendandhistogramChart.Appendmethods.
The script utilizes styles, such as DrawStyles.DashedLine for the line chart and DrawStyles.Histogram for the histogram, to visually distinguish different data presentations.
By implementing IAnalyticsScript, the ChartDrawScript class enables integrating an approach to executing customizable analytical scripts, making it a versatile tool for traders and analysts using the StockSharp platform.
Execution Result