3D Report
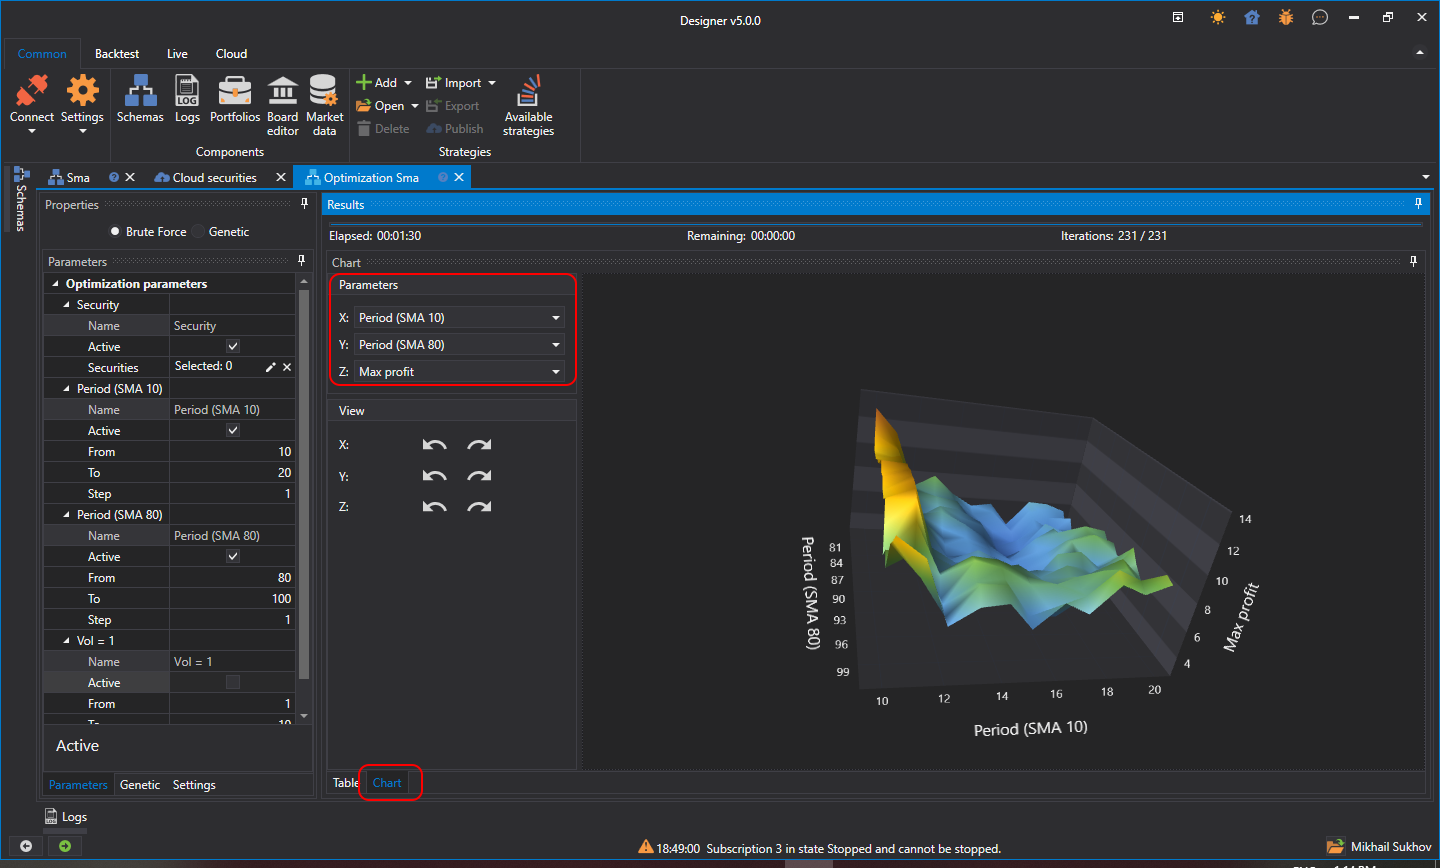
Optimization results can be viewed as a 3D chart. To do this, in the results panel, you need to switch the tab to Chart:

The chart can display in a 3-dimensional projection, meaning it can only accommodate 3 dimensions. Therefore, if the optimization is conducted over 4 or more parameters, to view the results, you need to change the dimensions for X and Y.
The dimension for Z must always be numerical, unlike X and Y, where dimensions can be, for example, by instruments.