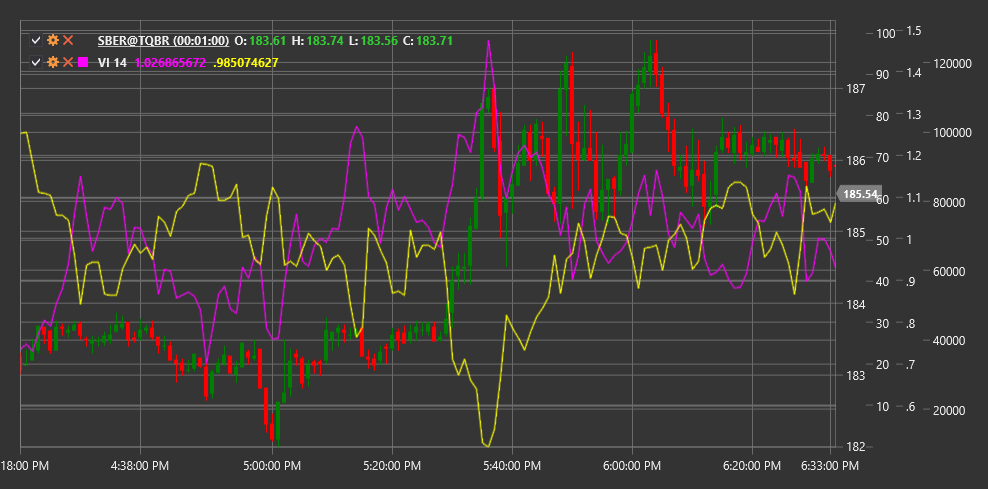
VI
Vortex Indicator (VI) is a technical indicator developed by Etienne and Julia Boisse in 2009. The indicator consists of two lines, VI+ and VI-, which show upward and downward price movement, helping to identify the beginning of new trends and confirm existing ones.
To use the indicator, you need to use the VortexIndicator class.
Description
The Vortex Indicator is inspired by the principles of vortex movement in nature and aims to reflect the cyclical nature of market movements. It consists of two lines:
- VI+ (positive Vortex Indicator) - measures upward price movement
- VI- (negative Vortex Indicator) - measures downward price movement
Main indicator signals:
- Buy when VI+ crosses VI- from bottom to top
- Sell when VI- crosses VI+ from bottom to top
- The degree of separation between the lines indicates trend strength
The Vortex Indicator is particularly useful for:
- Determining the start of new trends
- Assessing the strength of an existing trend
- Identifying potential reversal points
Parameters
- Length - calculation period, typically using a value of 14.
Calculation
The Vortex Indicator calculation is performed in several steps:
Calculate positive and negative movement:
VM+ = |Current High - Previous Low|
VM- = |Current Low - Previous High|
Calculate True Range:
TR = Max(High - Low, |High - Previous Close|, |Low - Previous Close|)Sum VM+ and VM- values over the Length period:
Sum_VM+ = Sum(VM+, Length)
Sum_VM- = Sum(VM-, Length)
Sum True Range over the Length period:
Sum_TR = Sum(TR, Length)Calculate normalized VI+ and VI- values:
VI+ = Sum_VM+ / Sum_TR
VI- = Sum_VM- / Sum_TR
The crossing of these two lines generates trading signals: when VI+ rises above VI-, it signals a bullish trend, and conversely, when VI- rises above VI+, it signals a bearish trend.
