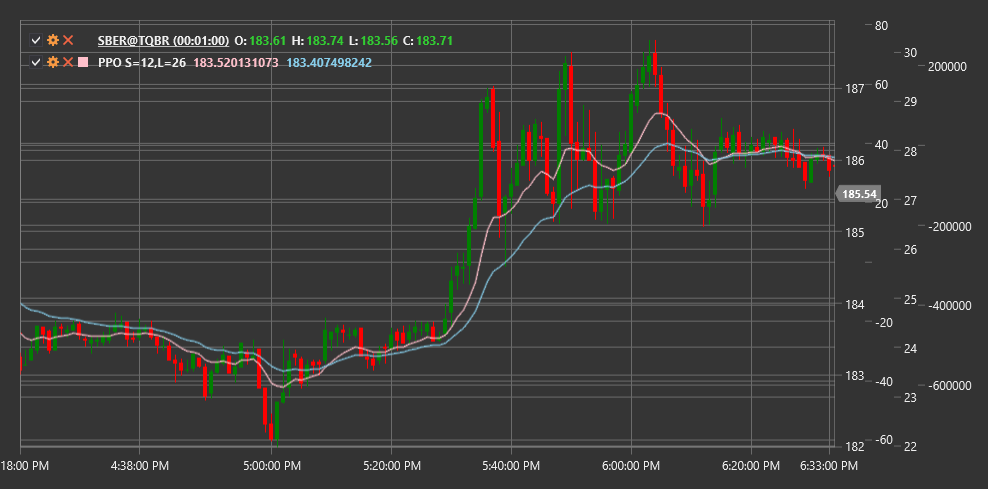
PPO
Percentage Price Oscillator (PPO) is a technical indicator similar to MACD, but expressing the difference between two exponential moving averages as a percentage rather than in absolute values.
To use the indicator, you need to use the PercentagePriceOscillator class.
Description
The Percentage Price Oscillator (PPO) is a variation of the more well-known MACD (Moving Average Convergence Divergence) indicator. The main difference is that PPO expresses the difference between two exponential moving averages as a percentage, rather than in absolute units. This makes PPO particularly useful when comparing different instruments with varying price levels or analyzing a single instrument over a long period when its price has changed significantly.
PPO consists of three components:
- PPO Line - difference between fast and slow EMA, expressed as a percentage
- Signal Line - EMA of the PPO line
- Histogram - difference between the PPO line and signal line
The PPO indicator oscillates around the zero line, where positive values indicate a bullish market sentiment, and negative values indicate a bearish sentiment. The magnitude of deviation from zero reflects the strength of the current trend.
Parameters
The indicator has the following parameters:
- ShortPeriod - period for calculating short EMA (default value: 12)
- LongPeriod - period for calculating long EMA (default value: 26)
Calculation
Percentage Price Oscillator calculation involves the following steps:
Calculate short and long exponential moving averages:
Short EMA = EMA(Price, ShortPeriod)
Long EMA = EMA(Price, LongPeriod)
Calculate PPO line as a percentage difference between short and long EMA:
PPO Line = ((Short EMA - Long EMA) / Long EMA) * 100Calculate signal line (typically 9-period EMA of PPO line):
Signal Line = EMA(PPO Line, 9)Calculate histogram:
Histogram = PPO Line - Signal Line
Where:
- Price - price (usually closing price)
- EMA - exponential moving average
- ShortPeriod - period for short EMA
- LongPeriod - period for long EMA
Interpretation
The Percentage Price Oscillator can be interpreted as follows:
Zero Line Crossovers:
- PPO line crossing the zero line from bottom to top can be viewed as a bullish signal
- PPO line crossing the zero line from top to bottom can be viewed as a bearish signal
Signal Line Crossovers:
- PPO line crossing the signal line from bottom to top can be viewed as a bullish signal
- PPO line crossing the signal line from top to bottom can be viewed as a bearish signal
Divergences:
- Bullish Divergence: price forms a new low, while PPO forms a higher low
- Bearish Divergence: price forms a new high, while PPO forms a lower high
Overbought/Oversold:
- Extremely high positive PPO values may indicate market overbought conditions
- Extremely low negative PPO values may indicate market oversold conditions
Histogram Analysis:
- Histogram expansion indicates strengthening of the current trend
- Histogram contraction indicates weakening of the current trend
- Change in histogram color (or sign) indicates a change in short-term momentum
Instrument Comparison:
- Unlike MACD, PPO can be used for direct comparison of different instruments
- Higher PPO values for one instrument compared to another may indicate stronger relative momentum
Signal Filtering:
- Signal line crossover signals are more reliable when PPO is in line with the main trend
- For example, bullish signals are more reliable when PPO is positive, and bearish signals are more reliable when PPO is negative
