Ichimoku
Ichimoku is an indicator represented by a combination of five lines, three of which are moving averages, and two are derivatives of these. Ichimoku identifies the presence of a trend, as well as indicates support/resistance zones and trend retracements.
To use the indicator, the Ichimoku class should be used.
Description of the Ichimoku Indicator
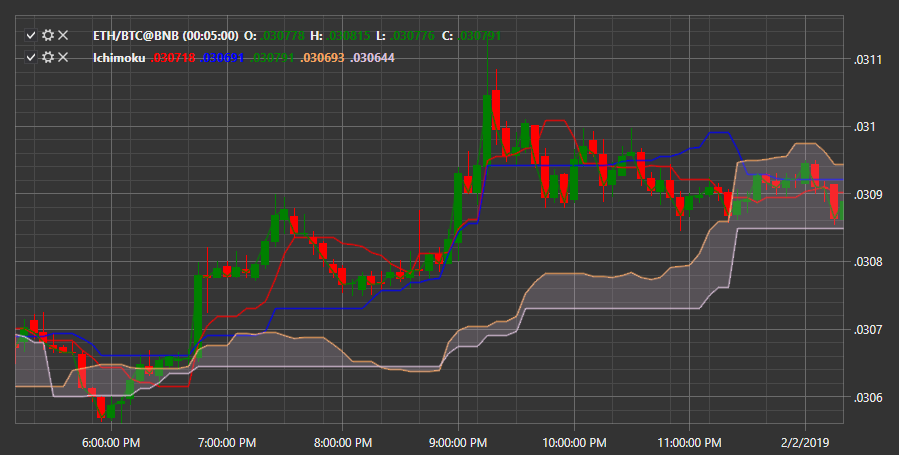
Graphically, the indicator consists of five colored lines similar to simple moving averages:
Tenkan (conversion line) — the fastest line, it reacts first to price changes. Its main purpose is to determine the direction of the short-term trend. In the classic version, it takes a segment of 9 bars back. It is constructed as half the sum of the highest and lowest prices.
Kijun (base line) — indicates the medium-term trend, with a period of 26.
Senkou A and Senkou B — projected and displayed 26 periods into the future, together they form what is called the cloud (Kumo), which shows areas of support and resistance and is a key component of the indicator.
Chikou (lagging span) — represents the last closing price, shifted 26 periods back. It helps confirm signals: if it crosses the chart from bottom to top, it's a buy signal, and from top to bottom — a sell signal. Essentially, Chikou acts as a trend filter.