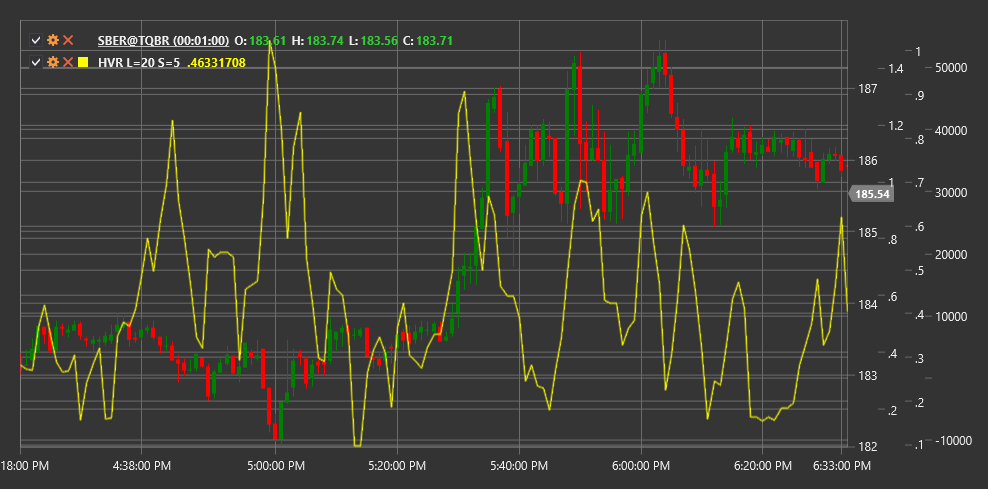
HVR
Historical Volatility Ratio (HVR) is a technical indicator that compares short-term historical volatility with long-term historical volatility to assess changes in market activity.
To use the indicator, you need to use the HistoricalVolatilityRatio class.
Description
The Historical Volatility Ratio (HVR) is a relative volatility indicator that compares short-term volatility with long-term market volatility. The indicator helps determine whether current volatility is increasing or decreasing relative to its historical level.
HVR is calculated as the ratio of short-term historical volatility to long-term historical volatility. Values above 1.0 indicate that current (short-term) volatility is higher than long-term volatility, which may signal increased market activity or a potential trend change.
The indicator is particularly useful for:
- Identifying periods of high and low volatility
- Determining potential trend reversal points
- Adapting trading strategies to current market conditions
- Assessing market risk and setting appropriate position sizes
Parameters
The indicator has the following parameters:
- ShortPeriod - period for calculating short-term volatility (default value: 5)
- LongPeriod - period for calculating long-term volatility (default value: 20)
Calculation
Historical Volatility Ratio calculation involves the following steps:
Calculate short-term historical volatility:
Short-term Volatility = Standard Deviation of Log Returns over ShortPeriod * Sqrt(Trading Days Per Year)Calculate long-term historical volatility:
Long-term Volatility = Standard Deviation of Log Returns over LongPeriod * Sqrt(Trading Days Per Year)Calculate HVR as the ratio of short-term volatility to long-term volatility:
HVR = Short-term Volatility / Long-term Volatility
Where:
- Log Returns - logarithmic returns (ln(Price[i] / Price[i-1]))
- Standard Deviation - standard deviation
- Trading Days Per Year - number of trading days in a year (usually 252 for stock markets)
- ShortPeriod - short period for volatility calculation
- LongPeriod - long period for volatility calculation
Interpretation
The Historical Volatility Ratio can be interpreted as follows:
Level 1.0:
- HVR = 1.0 means short-term volatility is equal to long-term volatility
- HVR > 1.0 indicates short-term volatility is higher than long-term volatility
- HVR < 1.0 indicates short-term volatility is lower than long-term volatility
Extreme Values:
- Very high HVR values (e.g., > 2.0) may indicate a sharp volatility increase, often occurring during market panics or strong movements
- Very low HVR values (e.g., < 0.5) may indicate a volatility compression period, often preceding strong movements
HVR Trends:
- Rising HVR indicates an increase in current volatility
- Falling HVR indicates a decrease in current volatility
Trading Strategies:
- When HVR is high, it may be appropriate to use breakout-based strategies
- When HVR is low, mean reversion or range trading strategies may be more suitable
Risk Management:
- High HVR values may signal the need to reduce position sizes due to increased volatility
- Low HVR values may allow increased position sizes due to reduced volatility
Potential Reversals:
- Extreme HVR values often precede significant price movements
- A sharp HVR increase after a low volatility period may signal the start of a new trend
