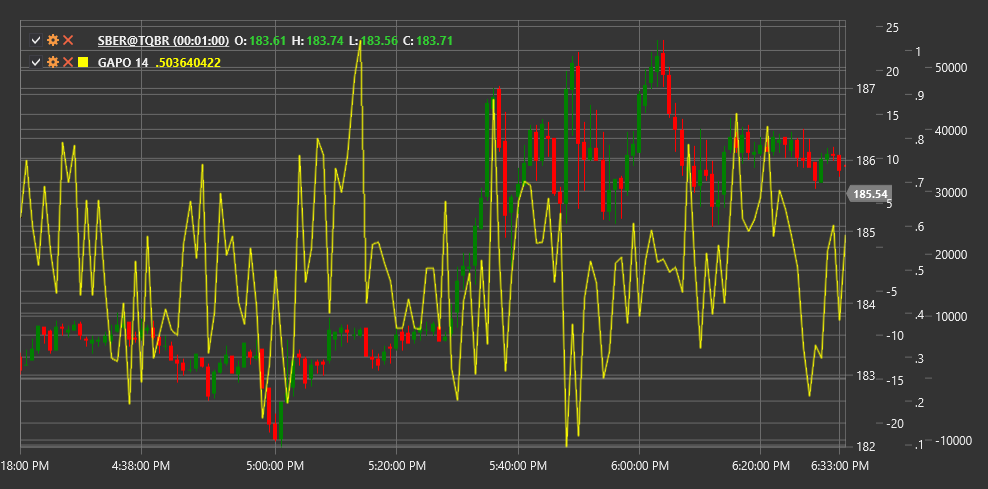
GAPO
Gopalakrishnan Range Index (GAPO) is a technical indicator developed by Tushar Gopalakrishnan to measure market volatility using a logarithmic scale.
To use the indicator, you need to use the GopalakrishnanRangeIndex class.
Description
The Gopalakrishnan Range Index (GAPO) is a volatility indicator that uses a logarithmic scale to measure the overall price range over a specific period. It was developed by Tushar Gopalakrishnan and presented in the "Technical Analysis of Stocks & Commodities" magazine.
GAPO evaluates extreme market movements by measuring the logarithmic ratio between the maximum and minimum prices over a given period. This approach allows the indicator to more accurately reflect increased volatility, especially during periods of sharp price movements.
The GAPO indicator is particularly useful for:
- Identifying periods of high and low volatility
- Detecting potential reversal points after extreme movements
- Adjusting parameters for other volatility-based indicators
- Adapting trading strategies to current market conditions
Parameters
The indicator has the following parameters:
- Length - calculation period (default value: 10)
Calculation
The Gopalakrishnan Range Index calculation is quite simple:
GAPO = log(N) * log(Highest High - Lowest Low)
Where:
- log - natural logarithm
- N - number of periods (Length)
- Highest High - highest high over the Length period
- Lowest Low - lowest low over the Length period
Interpretation
The Gopalakrishnan Range Index can be interpreted as follows:
Absolute Values:
- High GAPO values indicate periods of high volatility
- Low GAPO values indicate periods of low volatility
- Extremely high values may indicate possible market overextension and potential reversal
GAPO Trends:
- Increasing GAPO values indicate increasing volatility
- Decreasing GAPO values indicate decreasing volatility
- A sharp GAPO jump may signal the beginning of a new trend movement
Relative Levels:
- Comparing the current GAPO value with its historical levels allows assessment of relative volatility
- Values above the 95th percentile of the historical range may indicate extreme volatility
- Values below the 5th percentile of the historical range may indicate unusually low volatility
Trading Strategies:
- During high volatility periods (high GAPO values), it may be appropriate to increase stop-loss and target profit sizes
- During low volatility periods (low GAPO values), range trading strategies may be more suitable
- Extreme GAPO values can be used as contrary indicators for finding reversal points
Combination with Other Indicators:
- GAPO can be used to filter signals from other indicators
- During high volatility periods, trend indicator signals may be more reliable
- During low volatility periods, oscillator signals may be more effective
