FDI
Fractal Dimension Index (FDI) quantifies the roughness of a price series.
To use the indicator, you need to use the FractalDimension class.
Description
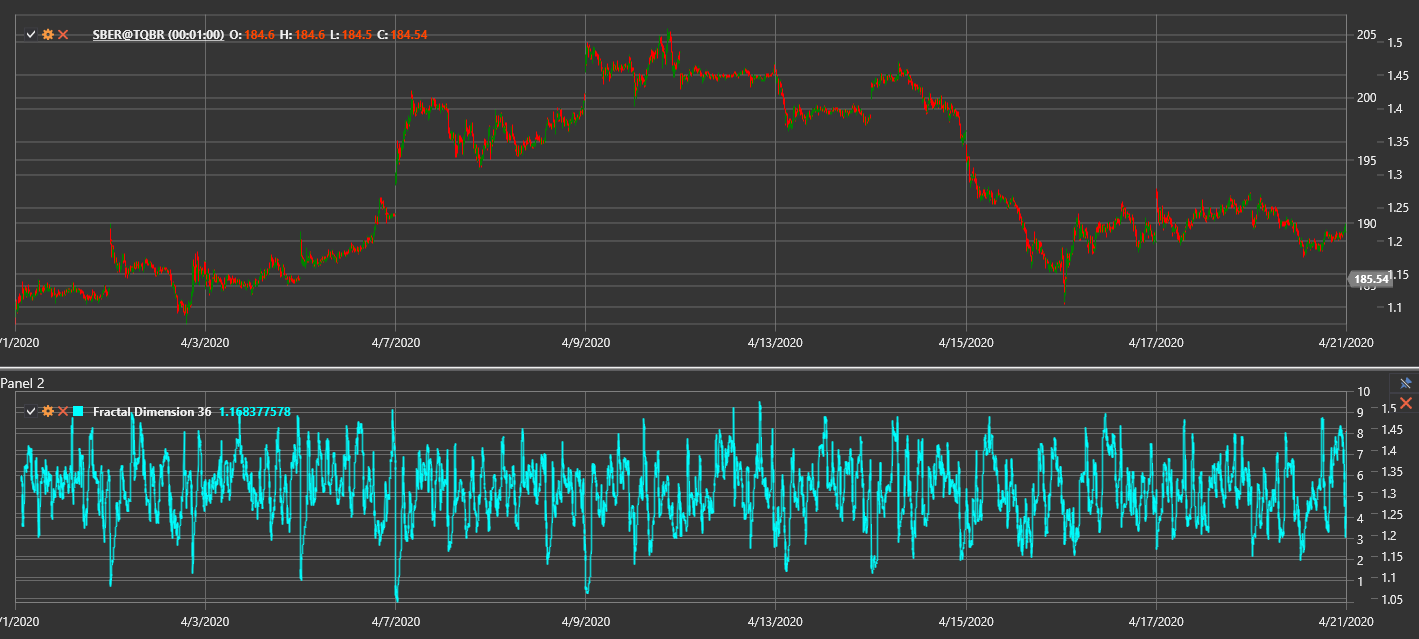
The FDI ranges from 1 to 2 and reflects market behavior:
- Values near 1 indicate a persistent trend (smoother path).
- Values around 1.5 correspond to a random walk.
- Values close to 2 denote a ranging or noisy market.
The indicator is based on fractal geometry and measures how complex the price path is.
Parameters
The indicator has the following parameter:
- Length – calculation period (default value: 30)
Calculation
FDI is computed by comparing the total price path length with the overall high-low range:
- Sum absolute differences between consecutive prices over the period to get the price path length.
- Find the difference between the maximum high and minimum low for the period.
- Calculate FDI using:
FDI = 1 + (log(PathLength) - log(Range)) / log(2 * (Length - 1)) - Clamp the result between 1 and 2.
Interpretation
- FDI near 1 – strong trending behavior.
- FDI around 1.5 – random walk; trend strength is neutral.
- FDI closer to 2 – choppy or sideways market.