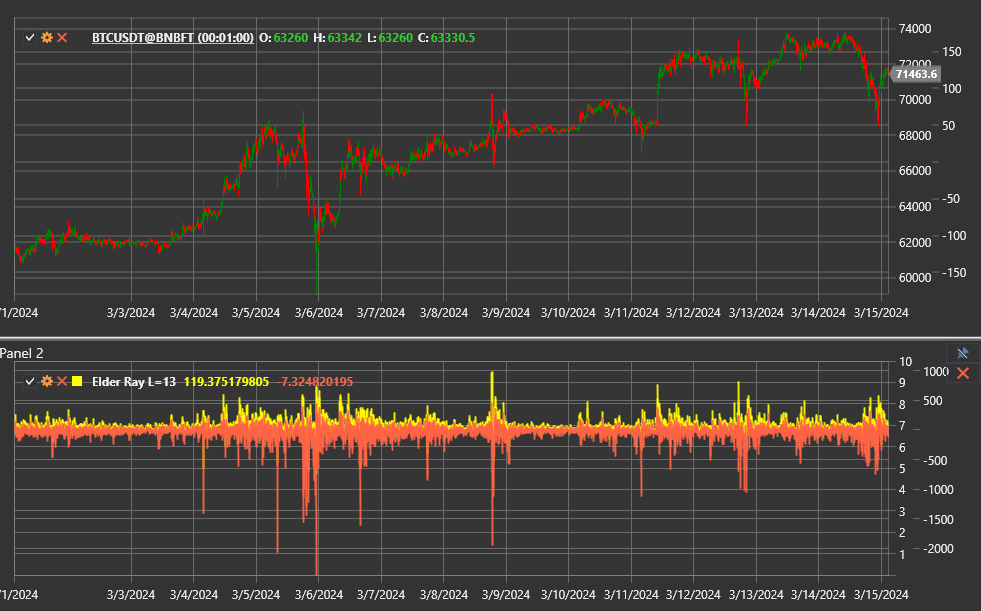
Elder Ray
The Elder Ray Index is a composite indicator by Alexander Elder that combines an exponential moving average with the Bull Power and Bear Power oscillators. It visualises the balance between buyers and sellers and helps identify when one side loses control.
Use the ElderRay class to access the indicator.
Components
The indicator returns a ElderRayValue structure containing:
- EMA — the baseline exponential moving average of closing prices;
- Bull Power — the distance between the bar high and the EMA;
- Bear Power — the distance between the bar low and the EMA.
Parameters
Elder Ray inherits the settings of ExponentialMovingAverage:
- Length — EMA period;
- Alpha — smoothing coefficient, when configured directly.
Interpretation
- Bull Power > 0 together with a rising EMA confirms an uptrend.
- Bear Power < 0 with a falling EMA confirms a downtrend.
- Shrinking Bull Power on rising prices or rising Bear Power on falling prices form divergences and warn about reversals.
- Zero-line crossings of Bull Power or Bear Power mark the shift in market control.
Trading decisions are made by analysing the EMA and both oscillators simultaneously. For example, a buying opportunity appears when the EMA is rising, Bear Power recovers from a fresh low, and Bull Power breaks above zero.