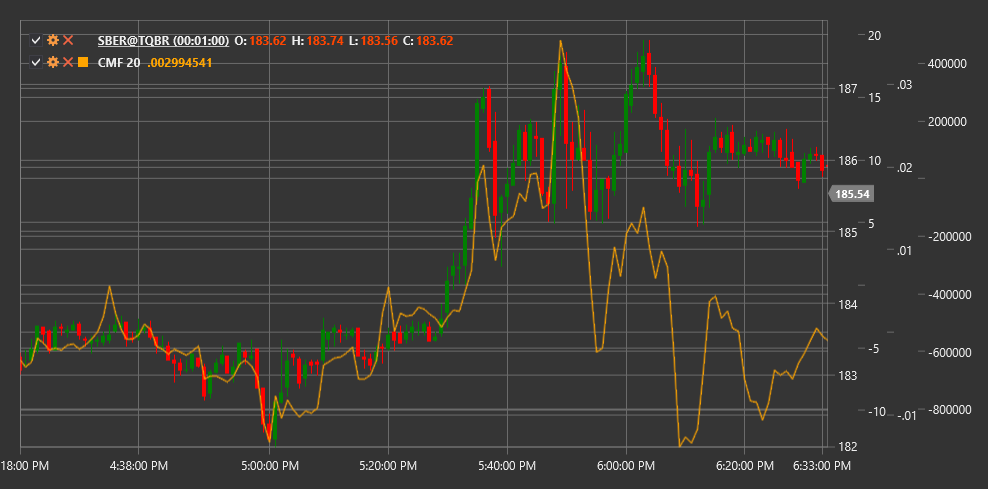
CMF
Chaikin Money Flow (CMF) is a technical indicator developed by Mark Chaikin that measures the strength of money flow (accumulation and distribution) in the market over a specific period.
To use the indicator, you need to use the ChaikinMoneyFlow class.
Description
Chaikin Money Flow (CMF) expands on the concept of the Accumulation/Distribution Line (A/D Line), focusing on a specific time period. The indicator measures money flow volume expressed as a percentage of total volume over the specified period.
CMF helps traders:
- Determine the strength of buying and selling pressure
- Identify accumulation (buying) and distribution (selling) trends
- Detect divergences between price movement and money flow
- Confirm the current trend or its weakness
The key idea of CMF is that in a strong upward trend, the closing price should be closer to the period's high, while in a strong downward trend, it should be closer to the period's low.
Parameters
The indicator has the following parameters:
- Length - calculation period (standard value: 20-21 days)
Calculation
CMF calculation involves the following steps:
Calculate Money Flow Multiplier for each period:
Money Flow Multiplier = ((Close - Low) - (High - Close)) / (High - Low)If (High - Low) = 0, then Money Flow Multiplier = 0.
Calculate Money Flow Volume for the period:
Money Flow Volume = Money Flow Multiplier * VolumeCalculate Chaikin Money Flow:
CMF = Sum(Money Flow Volume over Length period) / Sum(Volume over Length period)
Interpretation
CMF oscillates around the zero line and is typically within the range of -1 to +1:
Positive CMF values (above zero):
- Indicate buyer pressure (accumulation)
- The higher the value, the stronger the buyer pressure
- Particularly significant if sustained for a prolonged period
Negative CMF values (below zero):
- Indicate seller pressure (distribution)
- The lower the value, the stronger the seller pressure
- Prolonged stay in the negative zone confirms a downward trend
Zero Line Crossing:
- Crossing from bottom to top may indicate the start of an upward trend
- Crossing from top to bottom may signal the beginning of a downward trend
Divergences:
- Bullish Divergence: price declines while CMF rises (potential upward reversal)
- Bearish Divergence: price rises while CMF falls (potential downward reversal)
Extreme Levels:
- Values above +0.25 may indicate strong accumulation
- Values below -0.25 may indicate strong distribution
