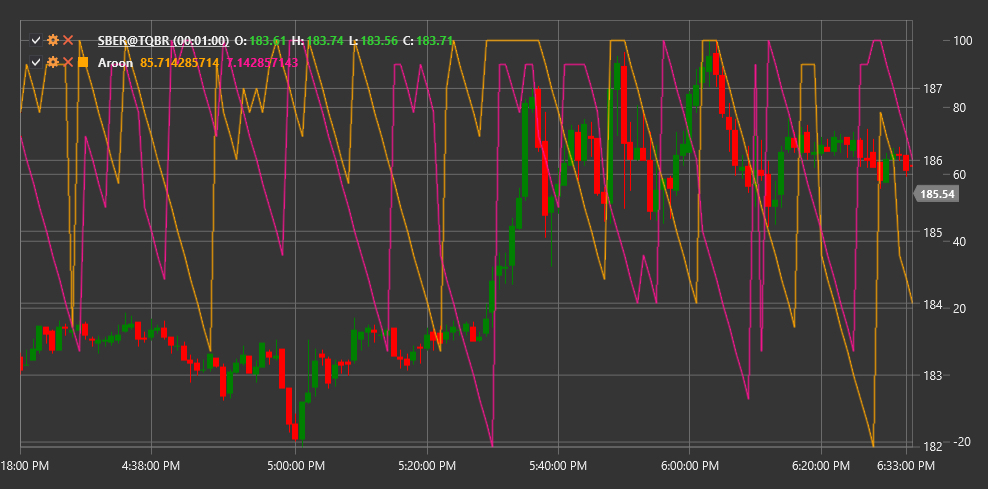
Aroon
Aroon Indicator is a technical indicator developed by Tushar Chande in 1995 to identify trend changes and trend strength. The name "Aroon" comes from a Sanskrit word meaning "dawn of a new era".
To use the indicator, you need to use the Aroon class.
Description
The Aroon Indicator consists of two lines:
- Aroon Up - measures the strength of an upward trend
- Aroon Down - measures the strength of a downward trend
Aroon helps determine:
- The beginning of a new trend
- The strength of the current trend
- Consolidation and sideways movement
- Potential trend reversals
The indicator is particularly useful for identifying early stages of a new trend formation and for determining consolidation periods.
Parameters
The indicator has the following parameters:
- Length - calculation period (typically 14-25 periods are used)
Calculation
The Aroon Indicator calculation is based on determining the time (number of periods) elapsed since reaching the maximum and minimum prices within the specified period:
Aroon Up is calculated using the formula:
Aroon Up = ((Length - Periods since high) / Length) * 100Aroon Down is calculated using the formula:
Aroon Down = ((Length - Periods since low) / Length) * 100
Where:
- Length - selected period
- "Periods since high" - number of periods since reaching the highest price within the Length period
- "Periods since low" - number of periods since reaching the lowest price within the Length period
Both Aroon lines oscillate between 0 and 100:
- A value of 100 means the high/low was reached in the most recent period
- A value of 0 means the high/low was reached Length periods ago
Interpretation
- Strong Upward Trend: Aroon Up is close to 100, and Aroon Down is close to 0
- Strong Downward Trend: Aroon Down is close to 100, and Aroon Up is close to 0
- Sideways Movement: both lines move parallel to each other at low levels
- Potential Trend Reversal: crossing of Aroon Up and Aroon Down lines
- Consolidation: both lines oscillate around 50
